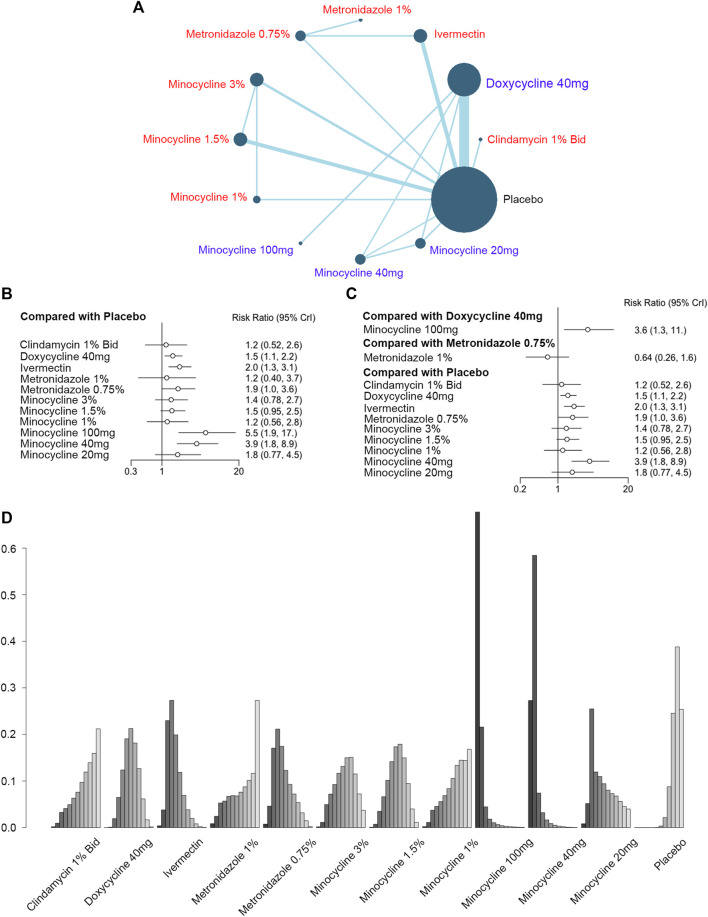
FIGURE 2.
Improvement of the Investigator’s Global Assessment (IGA). (A) Network plot of systemic (blue) and topical (red) antibiotic agents improving IGA scores included in the analyses. Each node indicates an intervention, and each direct comparison is represented as lines connecting two nodes. The size of the nodes is proportional to the number of randomly assigned participants. The width of the lines is proportional to the number of randomized clinical trials (RCTs) directly comparing the two connected treatments. Bid = twice a day. (B) Forest plot of indirect comparison of antibiotic agents improving IGA scores. (C) Forest plot of direct comparison of antibiotic agents improving IGA scores. (D) Rank plot of antibiotic agents improving IGA scores.

