FIGURE 5.
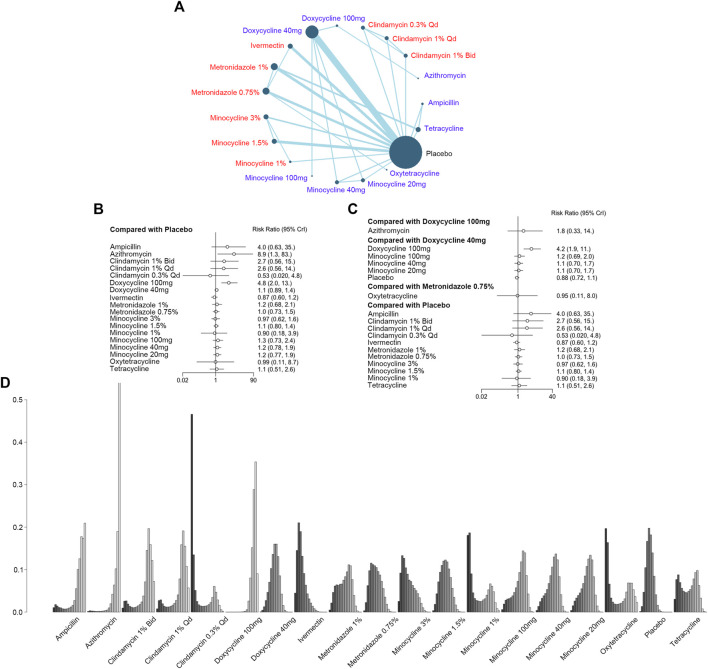
Report of adverse events (AEs). (A) Network plot of systemic (blue) and topical (red) antibiotic agents reporting adverse events included in the analyses. Bid = twice a day; qd = once a day. (B) Forest plot of indirect comparison of antibiotic agents reporting AEs. (C) Forest plot of direct comparison of antibiotic agents reporting AEs. (D) Rank plot of antibiotic agents reporting AEs.

