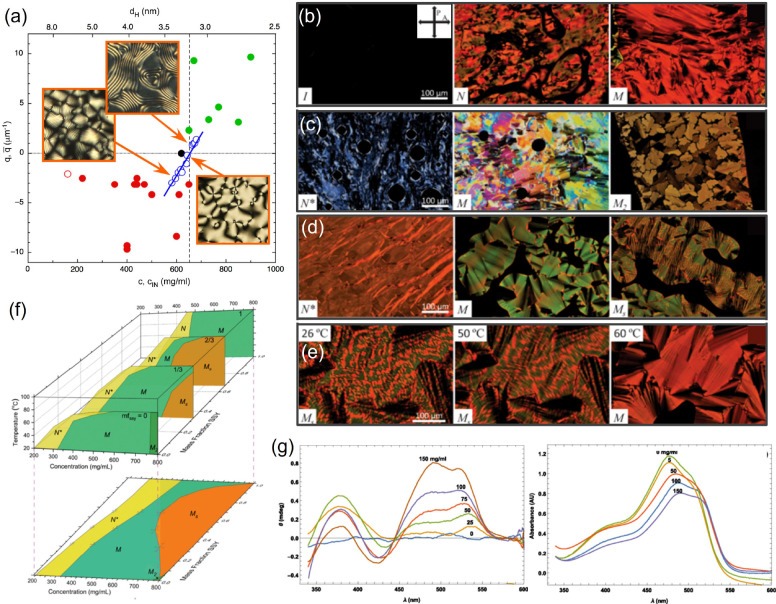
Figure 3.
Liquid crystalline phases in DNA oligomers and their mixtures with Sunset Yellow. (a) Dependence of the inverse N* periodicity on DNA concentration c (lower x axis) and on the corresponding interaxial distance dH (upper x axis) for different self-complementary oligomer sequences. Insets show POM textures. Positive and negative values correspond to right- and left-handed N*, respectively. (b) POM images of pure SSY solutions at room temperature, with increasing concentration from left to right, showing the isotropic I, nematic N, and columnar M mesophases. (c) POM images of pure DNA solutions at room temperature, with increasing concentration from left to right, showing the chiral nematic N* and two columnar M and M2 mesophases. (d) POM images of a SSY-DNA mixture at molar ratio of 0.57 at room temperature with increasing concentration from left to right, displaying N*, M, and a biphasic MS mesophase. (e) POM images of the SSY-DNA in (d) at increasing temperatures, showing the transition from MS to M. (f) Phase diagrams of SSY-DNA mixtures as a function of concentration, molar ratio, and temperature. The lower panel shows the projection at 20 °C. (g) CD and visible absorbance spectra of isotropic SSY-DNA mixtures with fixed [SSY] = 0.5 mg/mL and [DNA] increasing from 0 to 150 mg/mL. Since only SSY absorbs in this region, the spectra show that achiral SSY molecules are influenced by the chiral DNA duplexes. Adapted with permission from ref (18) and ref (13a). Copyright 2018 American Physical Society and 2021 National Academy of Sciences.

