
Figure 4.
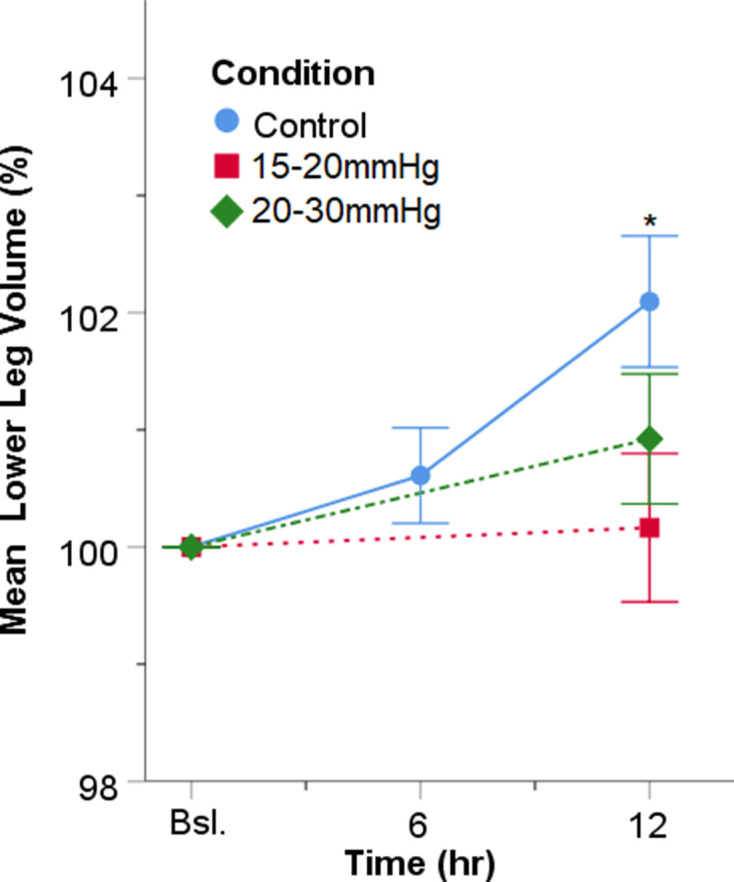
Lower-leg volume (%) changes relative to baseline (Bsl). Vertical bars indicate standard errors. * placed above the SE bar indicates a significant difference when compared with Bsl for the corresponding data point.
Official websites use .gov
A
.gov website belongs to an official
government organization in the United States.
Secure .gov websites use HTTPS
A lock (
) or https:// means you've safely
connected to the .gov website. Share sensitive
information only on official, secure websites.
Lower-leg volume (%) changes relative to baseline (Bsl). Vertical bars indicate standard errors. * placed above the SE bar indicates a significant difference when compared with Bsl for the corresponding data point.