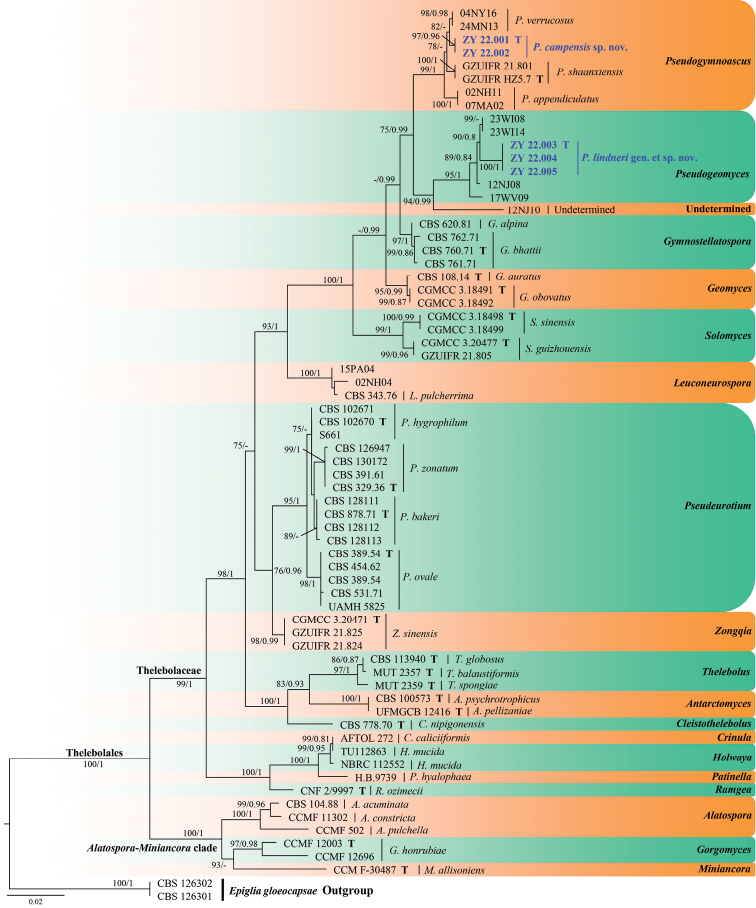
Figure 1.
Phylogram generated from a Maximum Likelihood analysis of sequences of Thelebolales, based on ITS and LSU. ML bootstrap values (≥ 75%) and Bayesian posterior probability (≥ 0.75) are indicated along branches (BP/ML). The new taxa are highlighted in bold and blue and “T” indicate ex-type cultures.

