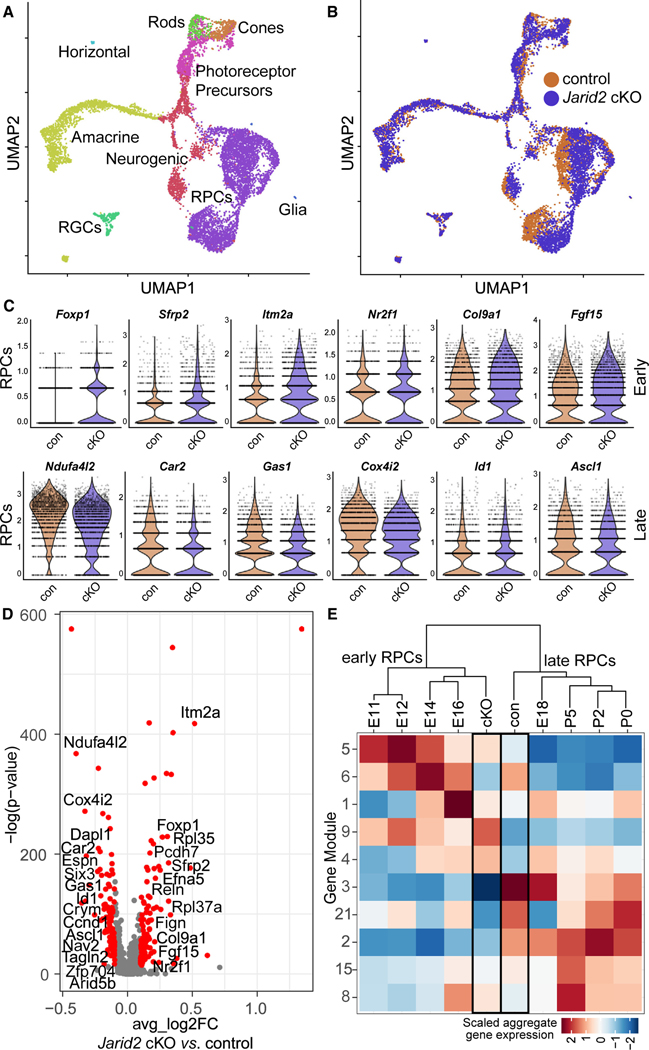
Figure 3. Increased early RPC gene expression in Rax-Cre Jarid2 cKO RPCs.
(A) UMAP dimensional reduction separates single cells from E18.5 retinas into distinct retinal cell types.
(B) Dimensional reduction based on mature transcripts highlights the difference between Jarid2 cKO and control RPCs.
(C) Violin plots of SCTransform-normalized mature transcript counts in Jarid2 control and cKO RPCs. These selected early and late RPC genes are significantly differentially expressed in the two populations by Wilcoxon rank-sum test (default for Seurat FindMarkers function).
(D) Differential expression analysis comparing total gene expression from Jarid2 cKO and control RPCs. Volcano plot of all expressed genes with significantly changed genes in red. p-adj < 0.05, average log2 fold change > 0.1. Genes are plotted such that those with increased expression in the Jarid2 cKO are on the right.
(E) Module analysis across retinal RPCs. Heatmap represents scaled aggregate gene expression for RPCs from Jarid2 cKO, Jarid2 control, and E11–P5 RPCs (raw data from Clark et al.11). See also Figure S4 and Tables S1 and S2.

