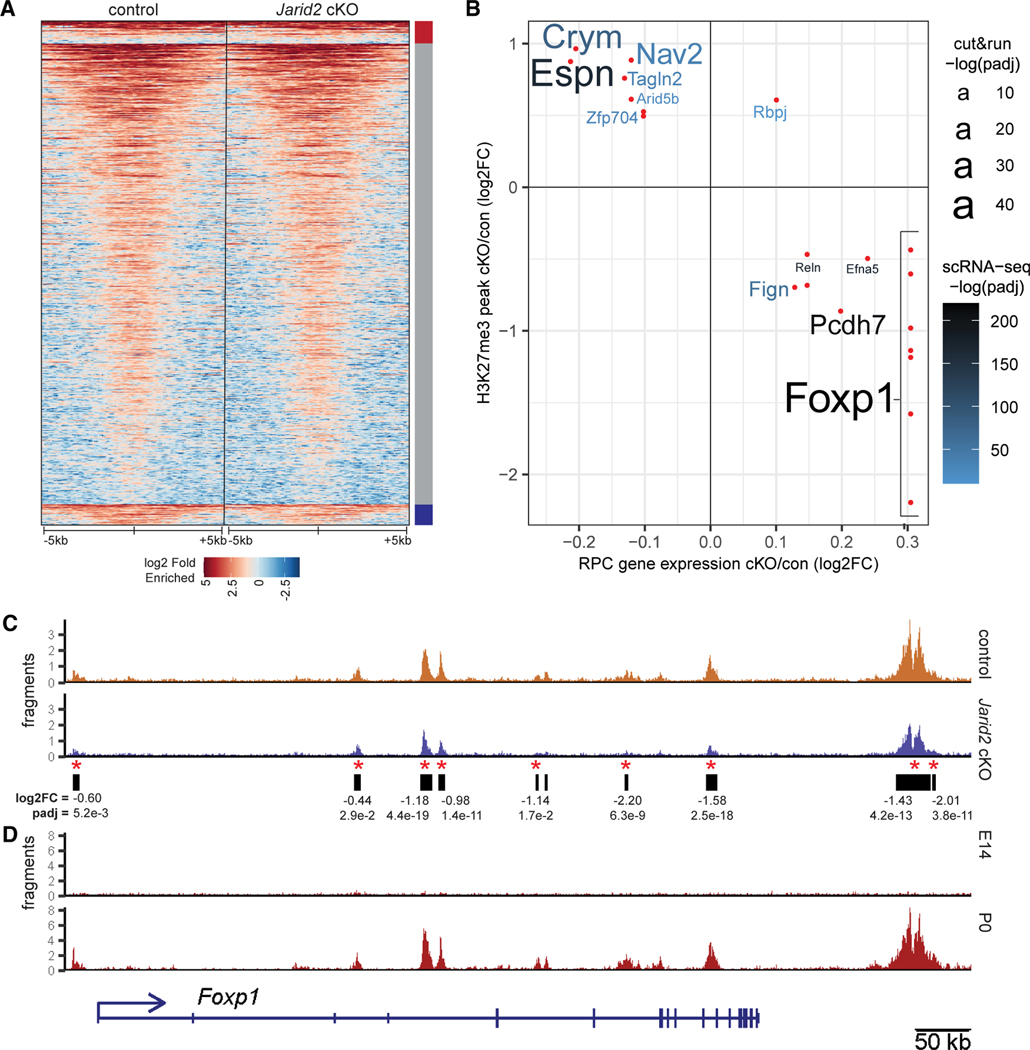
Figure 4. Jarid2 regulates H3K27me3 deposition at select genes.
(A) Heatmap of H3K27me3 enrichment compared with IgG, 5 kb to either side of the center of merged peaks called from E18.5 Jarid2 control and cKO CUT&RUN experiments. Peaks are grouped according to significant increase (red bar), decrease (blue bar), or no change (gray bar) in Jarid2 cKO. n = 8.
(B) Intersection of gene annotation for differentially regulated H3K27me3 peaks in whole retina and differentially expressed in Jarid2 cKO RPCs. Those peaks with reduced H3K27me3 and increased associated gene expression in Jarid2 cKO RPCs are in the bottom right quadrant. Relative confidence, −log(q value), is indicated by font size for CUT&RUN, or font color for scRNA-seq.
(C) Jarid2 control and cKO H3K27me3 CUT&RUN reads over the Foxp1 gene locus and called peaks (black bars). Red asterisk: significantly reduced peaks (q ≤ 0.05).
(D) H3K27me3 CUT&RUN tracks for wild-type whole retina at E14.5 and P0. See also Figure S6 and Table S3.

