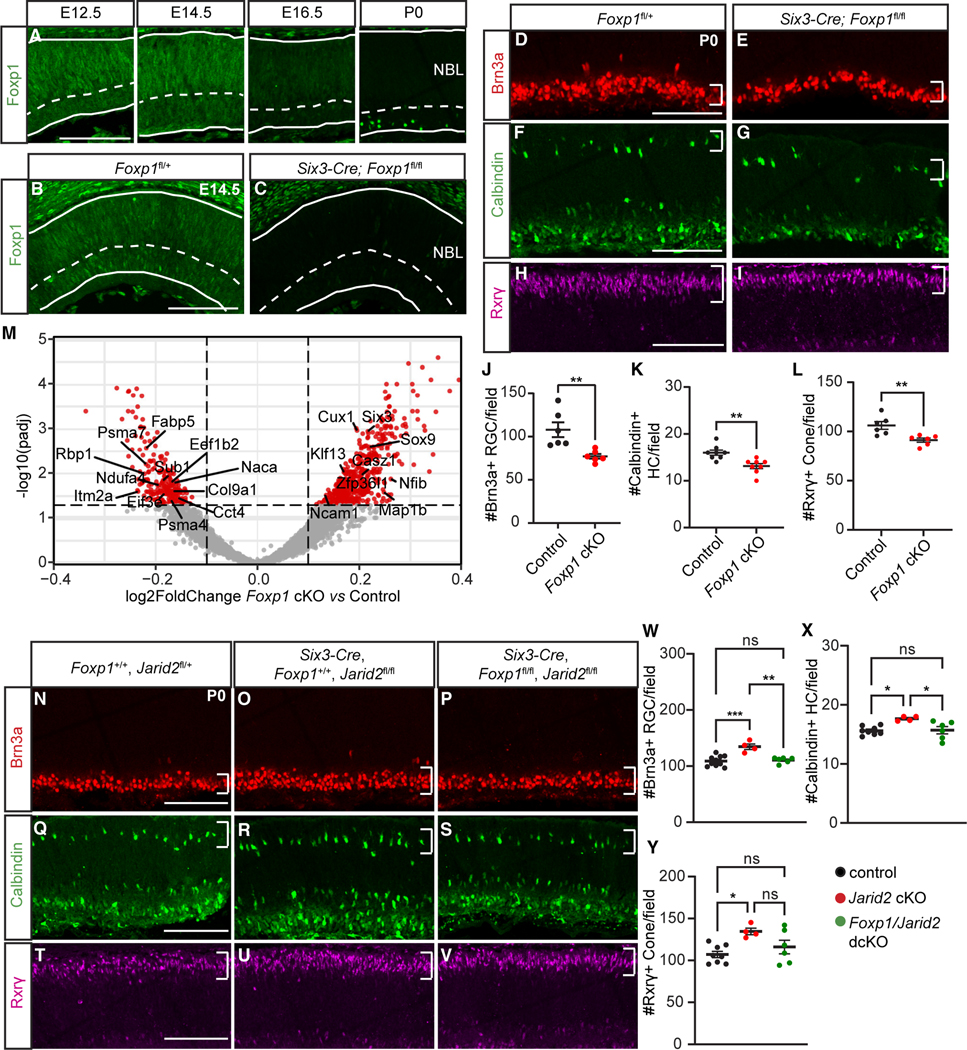
Figure 5. Foxp1 regulates generation of early-born retinal cell types.
(A) Foxp1 expression in wild-type retinas at E12.5, E14.5, E16.5, and P0.
(B and C) Foxp1 expression in the central retina of E14.5 Foxp1fl/+ (control) and Six3-Cre; Foxp1fl/fl (Foxp1 cKO) littermates.
(D–L) Foxp1 cKO retina showed (D, E, and J) reduced Brn3a-labeled RGCs, (F, G, and K) reduced Calbindin-labeled horizontal cells, and (H, I, and L) reduced Rxrγ-labeled cone photoreceptors within central dorsal retinas at P0. Regions of interest marked by white brackets.
(M) Cropped volcano plot of Foxp1 cKO E16.5 bulk RNA-seq results. Red dots represent significantly differentially expressed genes. p-adj < 0.05.
(N–V) Representative images of early-born retinal cell types in (N, Q, and T), control animals in (O, R, and U), and Six3-Cre Jarid2 cKO in (P, S, and V), or Foxp1:Jarid2 double cKO littermates at P0 with (W and Y) associated quantification.
(N–P and W) Brn3a-labeled cells, (Q–S and X) Calbindin-labeled horizontal cells, (T–V and Y) Rxrγ-labeled cone photoreceptors. Region of interest marked by white brackets. NBL, neuroblastic layer. Graphs represent mean ± SEM. n = 6 in (J and L) and Foxp1:Jarid2 double cKO in (W–Y), n = 8 in (K), and control in (X and Y), n = 10 in control in (W), n = 4 in Jarid2 cKO in (W–Y). *p < 0.05, **p < 0.01. ns, not significant. Scale bars, 100 μm. See also Tables S4 and S6 for statistical details.

