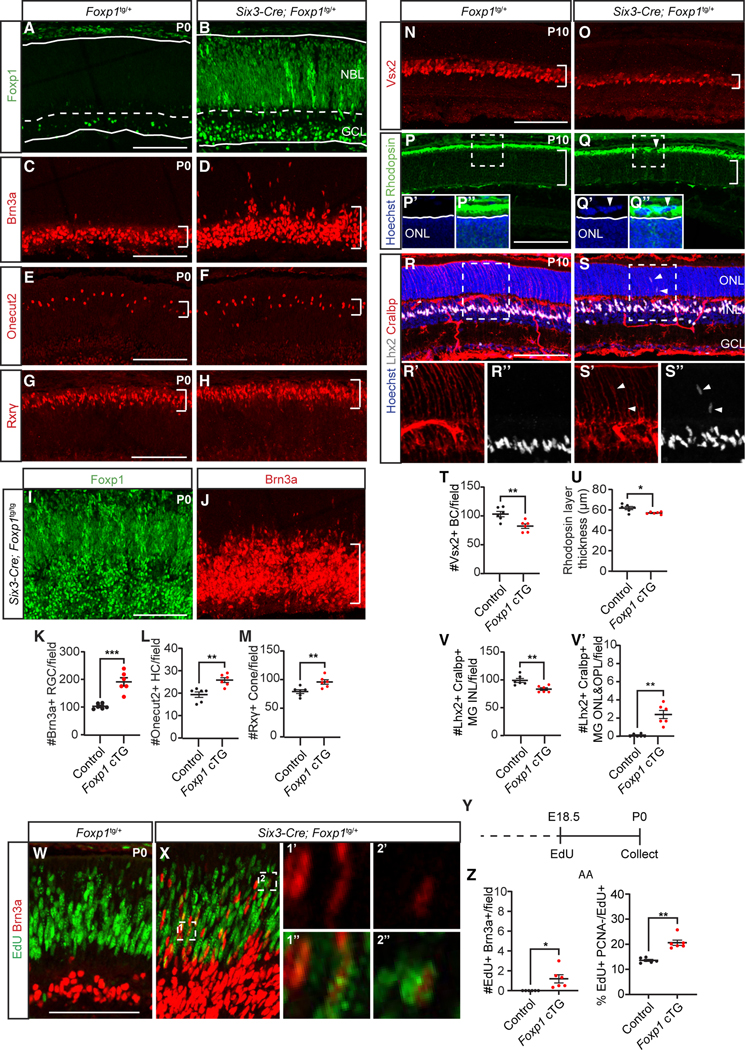
Figure 6. Sustaining Foxp1 in RPCs increases in early-born and decreases in late-born retinal cells.
(A and B) Foxp1 expression in P0 Foxp1tg/+ (control) and Six3-Cre; Foxp1tg/+ (Foxp1 cTG) littermates.
(C–H and K–M) Foxp1 cTG showed increased (C, D, and K) Brn3a-labeled RGCs (E, F, and L) Onecut2-labeled horizontal cells, and (G, H, and M) Rxrγ-labeled cone photoreceptors at P0.
(I and J) Foxp1 expression and Brn3a-labeled RGCs in P0 Six3-Cre; Foxp1tg/tg retina. Foxp1 cTG at P10 showed (N, O, and T) decreased Vsx2-labeled bipolar cells and (P, Q, and U) reduced thickness of Rhodospin-labeled rod photoreceptor layer. Arrowheads in (P) and (Q) indicate abnormal structure in the subretinal region.
(R, S, and V) Foxp1 cTG had reduced Lhx2 and Cralbp-colabeled Müller glia in the INL and (V′) increased Müller glia in the ONL and OPL. Arrowheads in (S, S’, and S′′) indicate mislocated Müller glia in the ONL and OPL.
(Y) Foxp1 cTG administered EdU at E18.5 and analyzed at P0 (W–Z) showed increased EdU+Brn3a+ RGCs. Zoomed-in images were from a single imaging plane. (AA) Foxp1 cTG retina showed increased cell-cycle exit of progenitors. NBL, neuroblastic layer; GCL, ganglion cell layer; ONL, outer nuclear layer; INL, inner nuclear layer. Graphs represent mean ± SEM, n = 6. *p < 0.05, **p < 0.01, ***p < 0.001, by Student’s t test. Scale bars, 100 μm. See also Figure S7 and Table S6 for statistical details.

