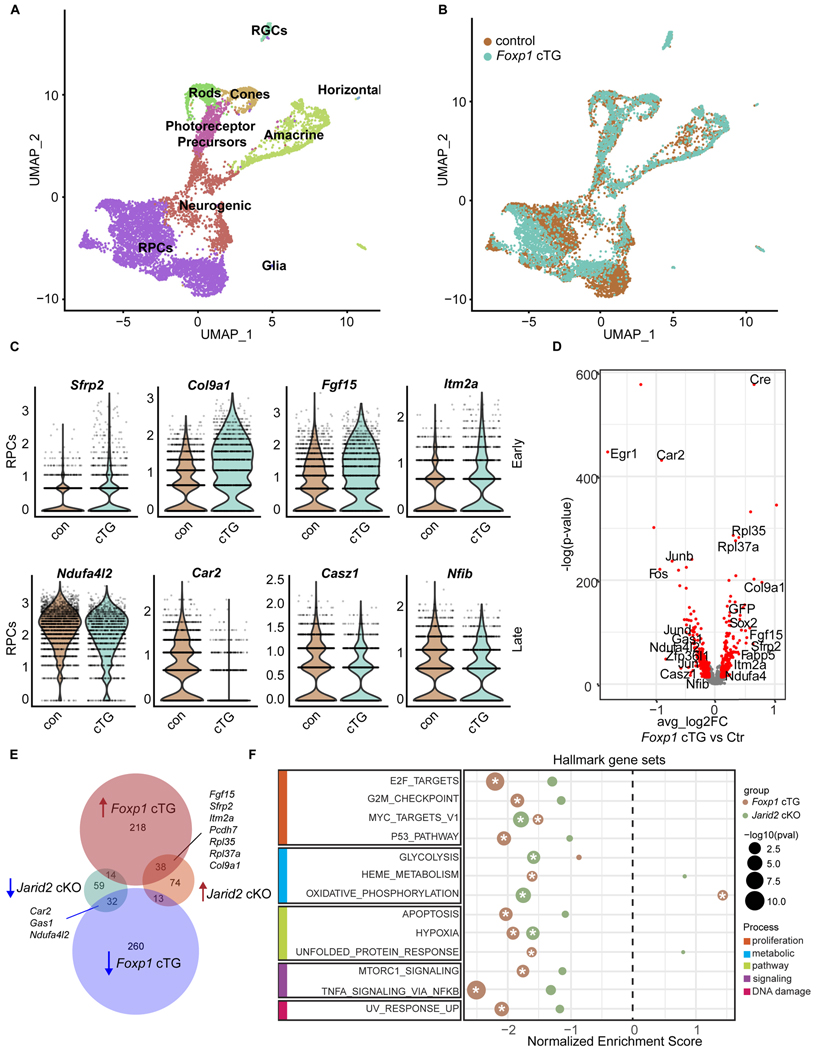
Figure 7. Elevated Foxp1 expression results in increased early RPC gene expression.
(A and B) UMAP dimensional reduction of scRNA-seq data from P0 Foxp1 cTG and littermate control, colored by annotated cell types (A) and colored by genotype (B).
(C) Violin plots of normalized transcript counts of selected early and late RPC genes differentially expressed in Foxp1 control and Foxp1 cTG RPCs.
(D) Volcano plot of all expressed genes, with genes significantly differentially expressed in Foxp1 cTG in red. p-adj < 0.01, average log2 fold change >0.1. Genes are plotted such that those with increased expression in the Foxp1 cTG are on the right.
(E) Venn diagram comparing differentially expressed genes common to Jarid2 cKO and Foxp1 cTG RPCs. RPC marker genes are shown.
(F) GSEA of MSigDB mouse hallmark gene sets. A positive enrichment score indicates enrichment in Jarid2 cKO (green) and Foxp1 cTG (brown) RPCs, while a negative score represents enrichment in the control. Significantly enriched genes sets (p-adj < 0.05) are marked with an asterisk. Gene sets are grouped by shared biological process. See also Table S5.

