Fig. 1.
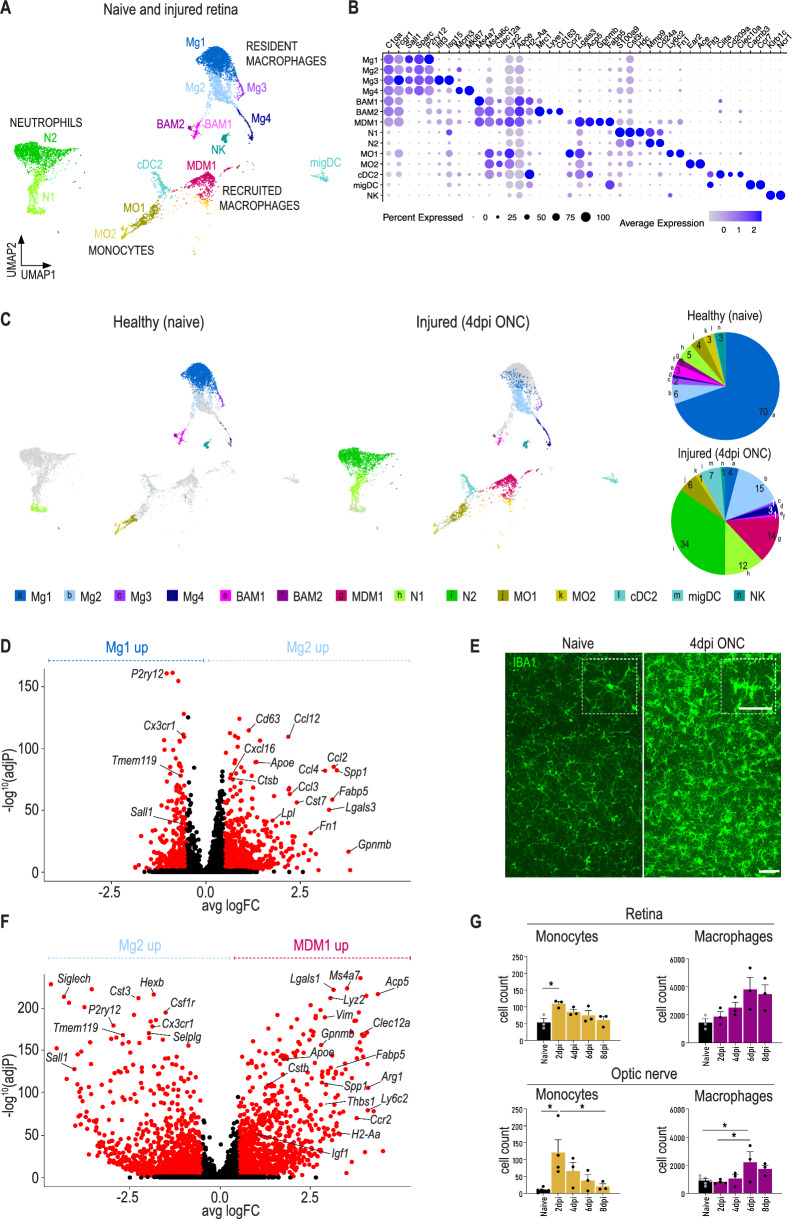
Injury to the optic nerve activates resident and recruited myeloid cells in the retina. A UMAP and cluster annotation showing 7128 CD45+CD11b+ cells isolated from healthy retinas (naive mice) or injured retinas (mice receiving ONC). BAM border associated macrophage, cDC conventional dendritic cell, migDC migratory dendritic cell, MDM monocyte-derived macrophage, Mg microglia, MO monocyte, N neutrophils, NK natural killer cell. Data originate from retinas pooled from 32 naive mice and 10 ONC mice. B Dot plot corresponding to UMAP in (A), showing expression of the indicated genes. Dot size represents the percentage of cells expressing the gene and colour represents its average expression within a cell cluster. C UMAP showing 2819 cells of healthy retinas and 4309 cells of injured retinas with a pie chart showing the distribution of different immune cell populations present in the healthy and injured retinas. Numbers in the pie chart represent percentages of the cell subsets. D Volcano plot displaying differential expression between Mg2 (injured microglia) and Mg1 (healthy microglia). Genes with adjusted p-value < 0.01 and I Log2(FC) I > 1 are shown in red. E Retinal wholemounts stained for IBA1 (green) labelling the microglia in the retina of naive mice and mice at 4 dpi ONC. Scale bar 50 µm and 25 µm. Representative images of n = 3–4 mice per condition. F Volcano plot displaying differential expression between MDM1 and Mg2. Genes with adjusted p-value < 0.01 and I Log2(FC) I > 1 are shown in red. G Cell counts of monocytes and macrophages at different time points after ONC in the retina and optic nerve, as measured by flow cytometry. Data are shown as mean ± SEM. Repeated measures one-way ANOVA followed by Tukey’s multiple comparisons test, n = 3–6 biologically independent samples with retinas from 4 mice pooled per sample. * P < 0.05

