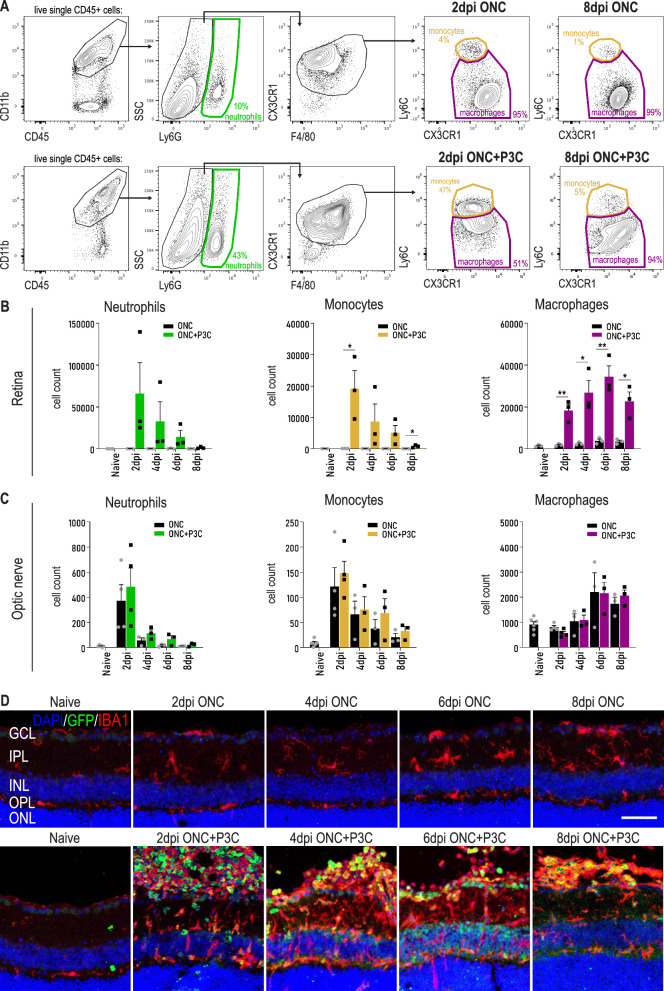
Fig. 2.
Inflammatory stimulation upon optic nerve injury mobilizes the infiltration of monocyte-derived cells. A Representative flow cytometry plots showing the gating strategy used to identify neutrophils (Cx3cr1low, Ly6Ghigh), monocytes (Ly6Chigh, Ly6G−) and macrophages (Cx3cr1high, Ly6Clow) in the retina and optic nerve of mice subjected to ONC and ONC combined with P3C treatment. Example plots were taken from retinas of mice at 2 dpi ONC and at 2 dpi ONC + P3C. Cells were pre-gated as live, single CD45+ cells. B Cell counts of neutrophils, monocytes and macrophages at different time points after ONC (black) and ONC + P3C (coloured) in the retina, as measured by flow cytometry. Counts of the monocytes and macrophages after ONC correspond to the data shown in Fig. 1G. Data are shown as mean ± SEM. Statistical significance between ONC and ONC + P3C was evaluated via an unpaired t-test. n = 3–6 biologically independent samples with retinas from 4 mice pooled per sample. * P < 0.05 ** P < 0.01 C Cell counts of neutrophils, monocytes and macrophages at different time points after ONC (black) and ONC + P3C (coloured) in the optic nerve, as measured by flow cytometry. Counts of the monocytes and macrophages after ONC correspond to the data shown in Fig. 1G. Statistical significance between ONC and ONC + P3C was evaluated via an unpaired t-test. n = 3–6 biologically independent samples with optic nerves from 4 mice pooled per sample. D Retinal cryosections of Lyz2-GFP (green) mice stained for IBA1 (red). Sections are counterstained with DAPI (blue). Scale bar 50 µm. GCL ganglion cell layer, IPL inner plexiform layer, INL inner nuclear layer, OPL outer plexiform layer, ONL outer nuclear layer. Representative images of n = 3 mice per condition

