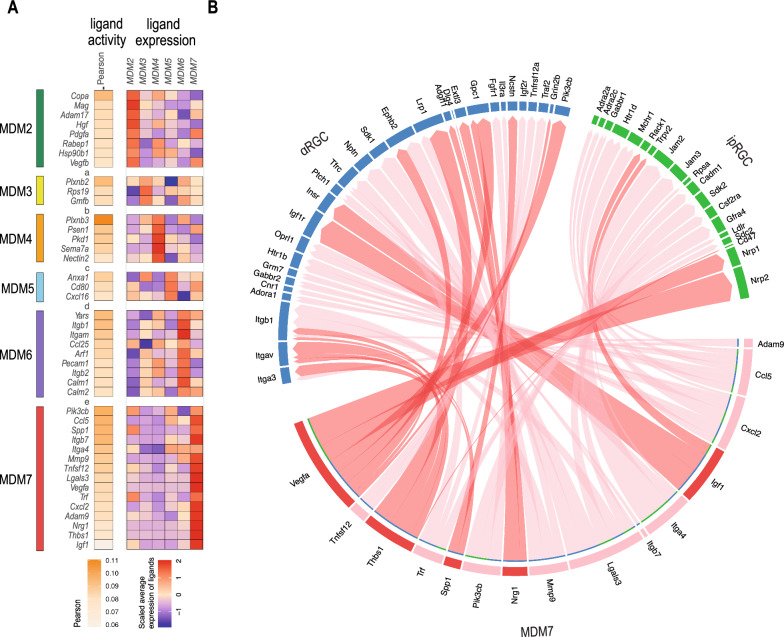
Fig. 6.
Identification of a pro-regenerative gene signature in monocyte-derived macrophages. A Top ligands of each macrophage cluster were selected and ranked based on their ligand activity values. Each ligand was assigned to a cluster if it was expressed highest in this cluster compared to the remaining sender clusters. The colour (white, low expression; orange, high expression) represents the predicted activity of the ligands. The expression of the top ligands in each cluster is shown with the colour (blue, low expression; red, high expression) representing the scaled average expression in the corresponding cluster. B Circle plot of potential ligand-receptor pairs, that shows the links between predicted ligands from MDM cluster 7 with their associated receptors found on alpha- and intrinsically photosensitive retinal ganglion cells

