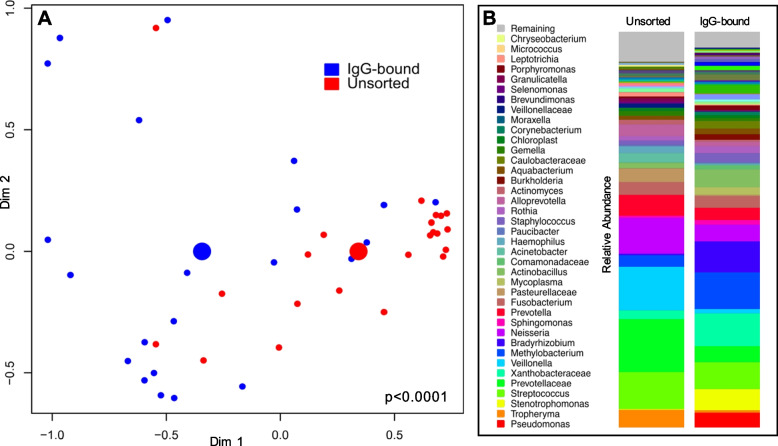
Fig. 1.
MACS identifies an IgG-bound lung microbiome that differs from raw BAL in healthy individuals. A non-metric multi-dimensional scaling plot (NMDS) (A) and stacked bar plots (B) detail the differences observed between the IgG-bound and raw lung microbiome in 22 individuals. A We applied an NMDS plot using Manhattan distance to visualize the sample clustering and performed a multivariate analysis of variance (PERMANOVA) to compare the beta diversity between IgG-bound and raw (unsorted) samples from 16S gene sequencing data. Points represent bacterial communities of individual samples, color-coded by IgG status (blue = IgG-bound, red = unsorted/raw). Larger colored centroids represent the mean group values. We found significant taxonomic differences between the groups (p < 0.0001, R2 = 0.09). B Stacked bar plots depict the relative abundance of bacteria in unsorted and IgG-bound BAL samples. In raw BAL samples, common oral microbes such as Streptococcus, Prevotella, and Veillonella were most abundant. The relative abundance of bacteria differed in the IgG-bound fraction

