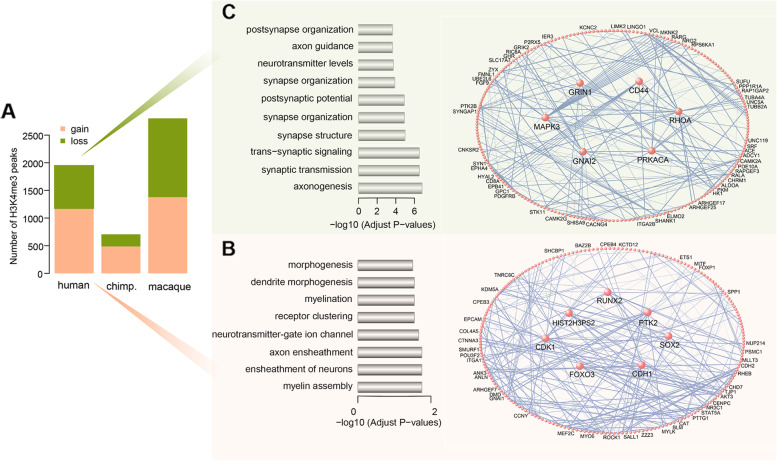
Fig. 2.
Human-specific signature of the H3K4me3 epigenome. A Number of species-specific H3K4me3 peaks. The orange represents H3K4me3 peaks with significant enrichment unique to each primate; green represents H3K4me3 peaks with significant depletion unique to each primate (n = 3) (See replicate data in Additional file 1: Tables S5 and S6). B Left panel: Gene ontology categories enriched with annotated genes adjacent to H3K4me3HP gain. The x-axis denotes log10-transformed BH-corrected P values. Right panel: Network visualization of genes adjacent to H3K4me3HP gain. C Left panel: Gene ontology categories enriched with annotated genes adjacent to H3K4me3HP loss. The x-axis denotes log10-transformed BH-corrected P values. Right panel: Network visualization of genes adjacent to H3K4me3HP loss. For these two networks, the largest sub-networks are shown. Each circle represents an individual gene. Genes with the highest connectivity (i.e., hubs) are shown as larger sizes

