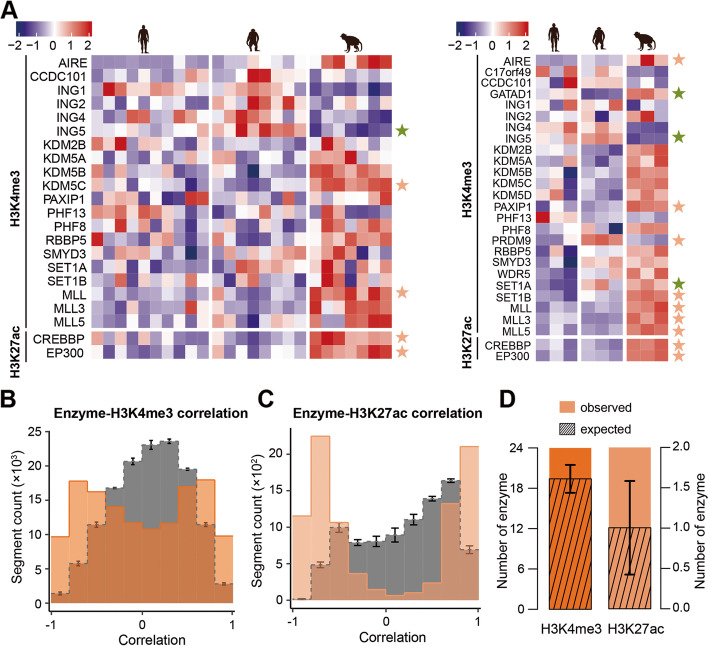
Fig. 6.
Expression profile of histone-modifying enzymes. A Heatmap of 22 histone-modifying enzymes based on gene expression levels measured in the RNA-seq dataset (left panel) and 27 histone-modifying enzymes based on the gene expression levels measured in the ssRNA-seq dataset (right panel). Corresponding human, chimpanzee, and macaque as indicated (top). Color scaled bars represent the normalized read counts. Stars on the right side denote species-specific expressed genes. Human-specific genes: SET1A; chimpanzee-specific genes: GATAD1, PRDM9; macaque-specific genes: AIRE, ING5, PAXIP1, KDM5C, SET1B, MLL, MLL3, MLL5, CREBBP, EP300. (orange: upregulated; green, downregulated). B Pearson correlation of 25 H3K4me3-modifying enzymes derived from ssRNA-seq dataset and 5459 species-specific H3K4me3 peaks. C Pearson correlation of two H3K27ac-modifying enzymes derived from ssRNA-seq dataset and 4404 species-specific H3K27ac peaks. B, C The gray bars represent the mean correlation coefficients expected by chance, calculated by randomly subsampling the same number of non-species-specific peaks and repeating the permutation 100 times. The test was conducted using the expression profiles for all three species. The error bars represent the mean ± 3SD. D Number of enzymes significantly correlated with H3K4me3 and H3K27ac peaks (colorful bars). The Pearson correlation of each enzyme derived from ssRNA-seq dataset and species-specific histone peaks was compared to the correlations between the same enzyme and the same number of non-species-specific peaks using one-sided Wilcoxon test (P < 0.01). The average number based on 1000 permutations is defined as the number of significantly correlated enzymes. The streaked bars represent the average number of correlated enzymes expected by chance, calculated from 1000 random samplings of nonenzymatic genes and the same number of non-species-specific histone peaks. The test was conducted using all three species’ expression profiles. The error bars represent the mean ± SD

