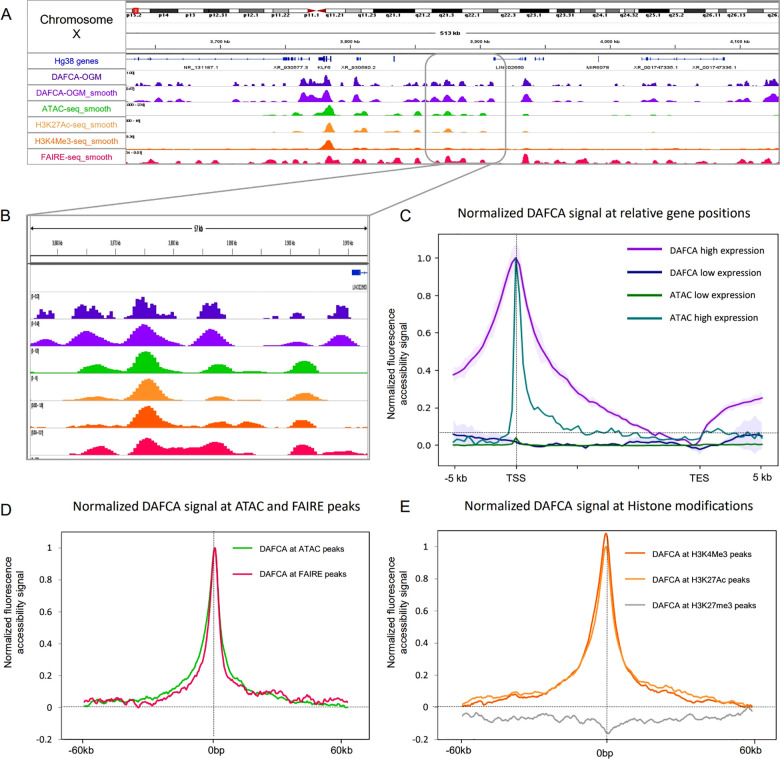
Figure 2.
A and B. Genome browser view of a 513 Kbp region on chromosome X, top to bottom; cytoband map; normalized DAFCA- OGM; smoothed DAFCA- OGM; smoothed ATAC-seq; smoothed H3K27Ac; smoothed H3K4Me3; smoothed FAIRE-seq; All data tracks were downloaded from ENCODE and smoothed as described in the Methods section. C. Meta-analysis of the normalized Chromatin and ATAC signal along genes. Signals are plotted for two gene groups; 5000 most expressed genes and 5000 nonexpressed genes. Error bars for chromatin tracks display their STD. D. Meta-analysis of the normalized chromatin data as a function of distance from ATAC (green) and FAIRE (red) peaks. E. Meta-analysis of the normalized DAFCA signal as a function of distance from histone modifications peaks: H3K4Me3 (orange), H3K27Ac (yellow), and H3K27Me3 (gray).

