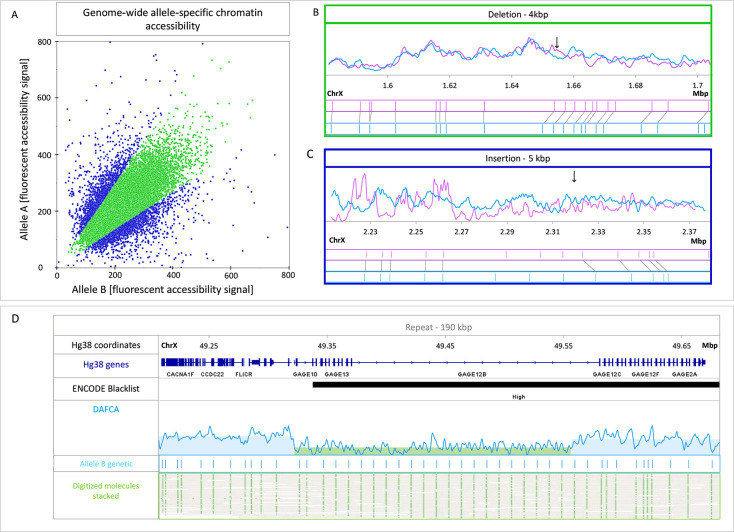
Figure 4.
A. Scatter plot for the DAFCA bins around 350 detected heterozygous SV’s. Bins showing above 1.5-fold change in chromatin accessibility are presented in blue. B. Representative region for the green bins showing similar chromatin accessibility for both alleles around a 4 Kbp deletion in chromosome X. The two alleles are presented in light blue and pink with chromatin accessibility on top and the genetic pattern shown beneath. C. Representative region for the blue bins showing differential chromatin accessibility for both alleles around a 5 Kbp insertion. D. Genome browser view of a 90 Kbp repeat on chromosome X, top to bottom: Hg38 genomic coordinates, Hg38 known gene locations, ENCODE blacklist track (ambiguous region in the reference), normalized DAFCA signal, OGM genetic pattern, and digitized representation of the mapped molecules to the GM12878 de novo assembly.

