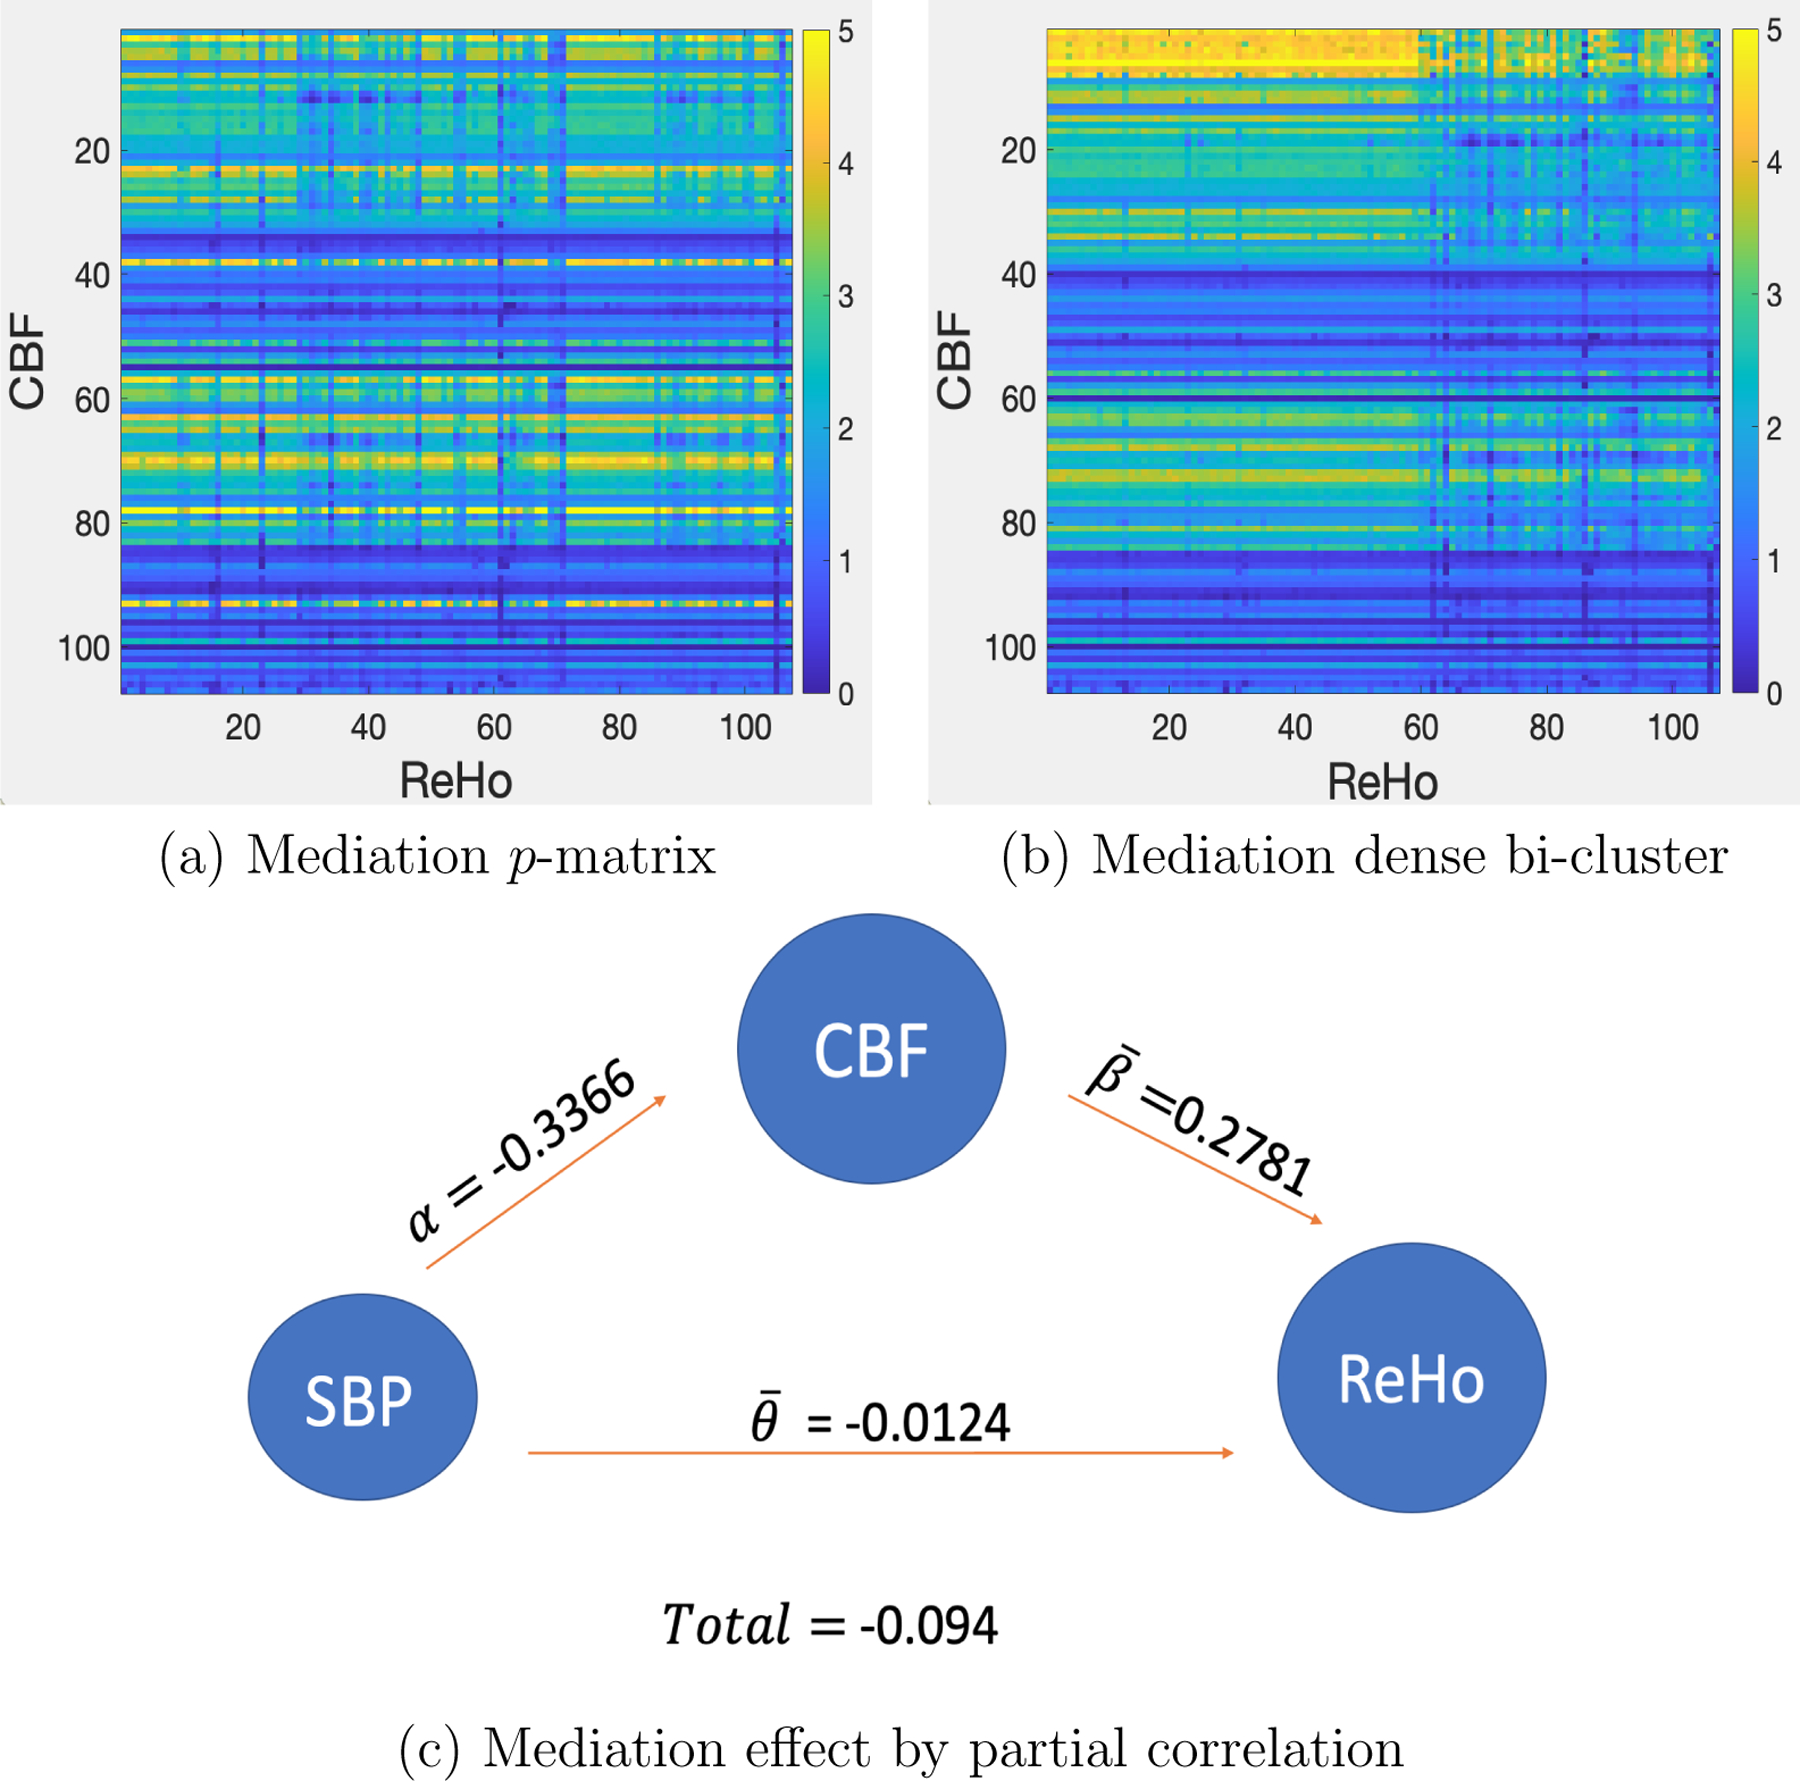
Figure 3:

The mediation analysis results for the data example. The mediation variable is systolic blood pressure (SBP). (a) is the heatmap of -matrix based on the input data. (b) is the heatmap with detected systematic mediation patterns. (c) is the mediation results based on the mediating factor. and effects are averaged across related outcome ROIs. Overall, the mediation proportion is high.
