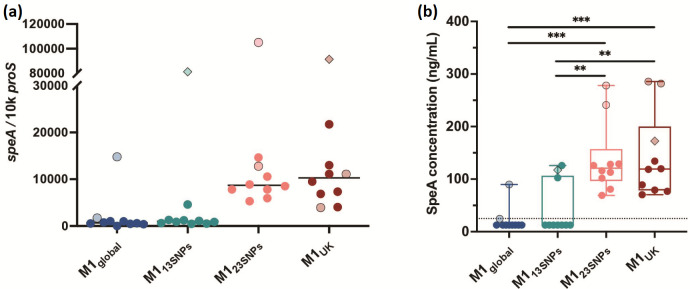
Fig. 4.
SpeA expression is increased in M123SNPs and M1UK sublineages. (a) Transcription of speA using 10 isolates from each sublineage is shown (total n=40). Each dot represents a single isolate (measured in triplicate) with light shading/fine black outline indicating the presence of a covRS mutation. Two isolates possessed both covRS and rgg4 mutations (diamond shapes). Solid line represents the median. There was no statistically significant difference between the sublineages in speA transcription, largely related to the outlying covRS mutants in each sublineage. Excluding isolates with covRS mutations a difference was observed between M1global and either M123SNPs or M1UK (P<0.0001), and a difference between between M113SNPs and either M123SNPs or M1UK (P=0.0002). Median fold difference M1UK versus M1global was 15.2 including all strains tested. (b) SpeA protein production by 40 invasive isolates (10 in each sublineage) cultured for 6 h in THB. Limit of detection was 25 ng ml−1. Isolates with undetectable SpeA were assigned a value of 12.5 ng ml−1. Median fold difference M1UK versus M1global was 9.5 including all strains tested. Box plot shows median and range. A multiple comparisons test was made using one-way ANOVA (Tukey’s): **P<0.01; ***P<0.001.

