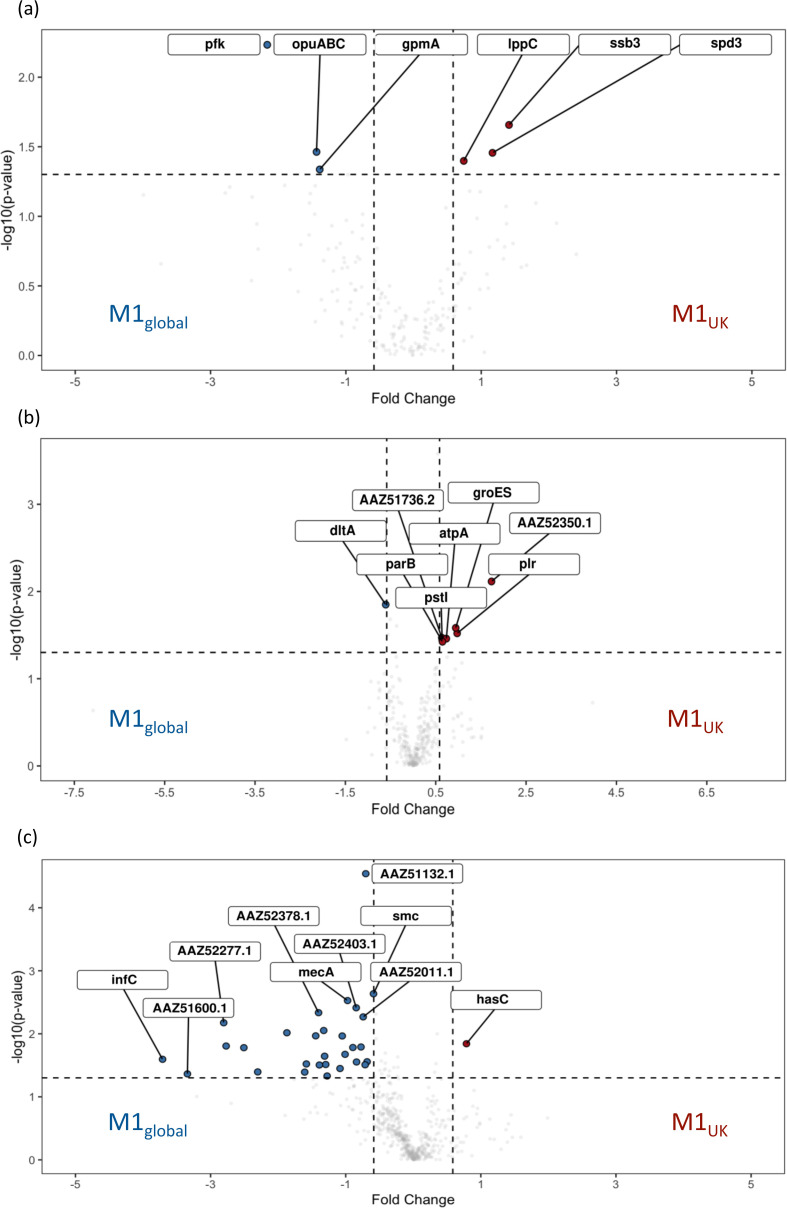
Fig. 5.
Volcano plots comparing proteins differentially produced by M1UK vs. M1global cultured in CDM. Log2 fold change is shown on the x-axis. Specific fractions examined were supernatant (a), cell wall (b) and cytosol (c). Proteins increased in M1UK are shown on the right in red. Those increased in M1global are shown on the left in blue. Comparisons are listed in the supporting Excel file (Figshare) [24].

