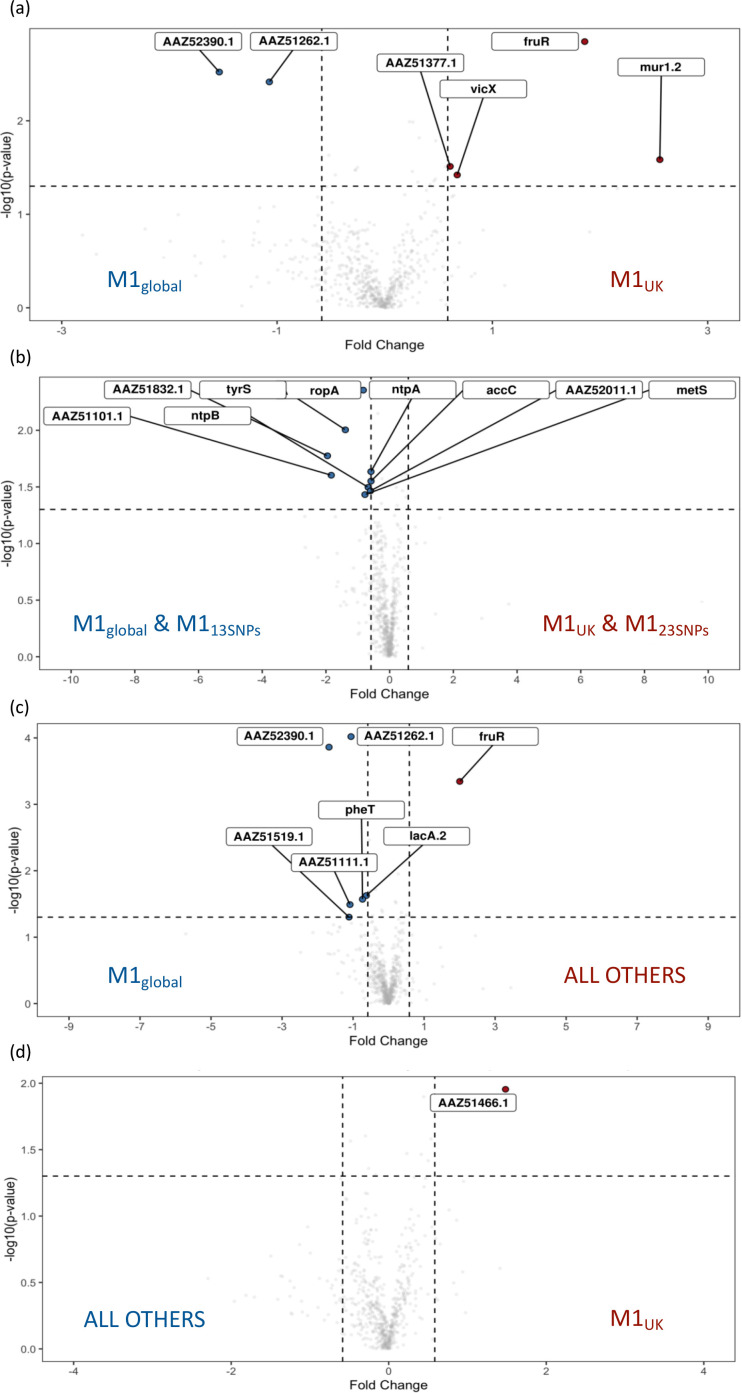
Fig. 6.
Volcano plots comparing proteins differentially produced when considering different pairings of M1global, M113SNPs, M123SNPs and M1UK cultured in CDM. Log2 fold change is shown on the x-axis. Cytosolic fractions only were compared as follows: (a) M1UK vs. M1global, (b) [M1UK + M123SNPs] vs. [M1global + M113SNPs], (c) all other sublineages vs. M1global, and (d) M1UK vs. all other sublineages. Comparisons are listed in the supporting Excel file (Figshare) [24].

