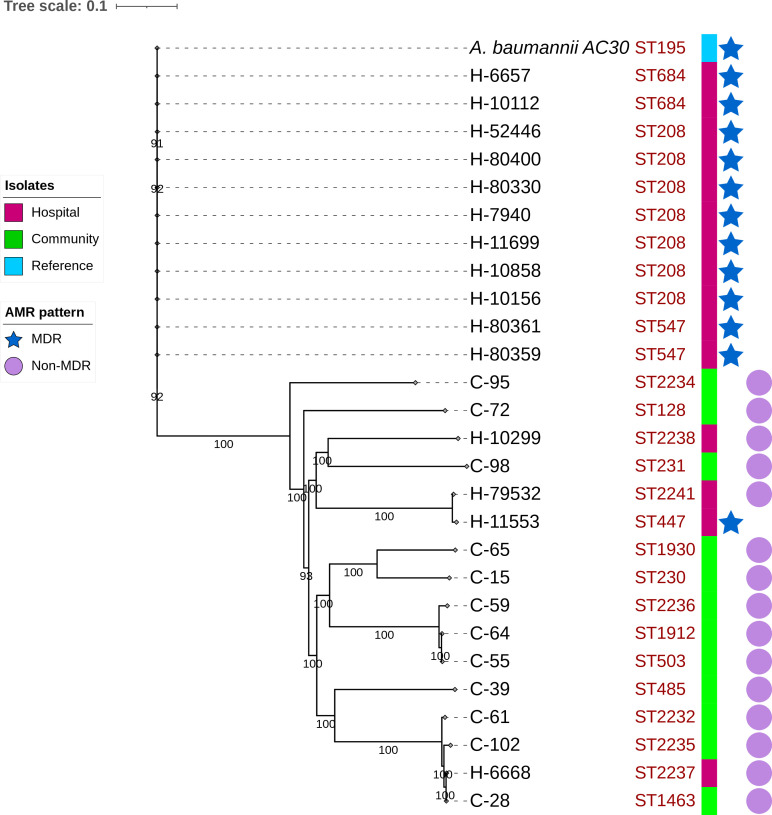
Fig. 2.
Phylogenetic tree using the maximum-likelihood method based on the core-genome SNP alignment of 27 sequenced community and hospital strains along with A. baumannii strain AC30 as a reference. Isolates are colour coded as purple and green for hospital and community isolates, respectively, and STs for each isolate are shown. The isolates’ sources and AMR patterns are displayed at the right and are represented by coloured squares, an asterisk for MDR isolates and circles for non-MDR, respectively. Bootstrap values are shown on each node.

