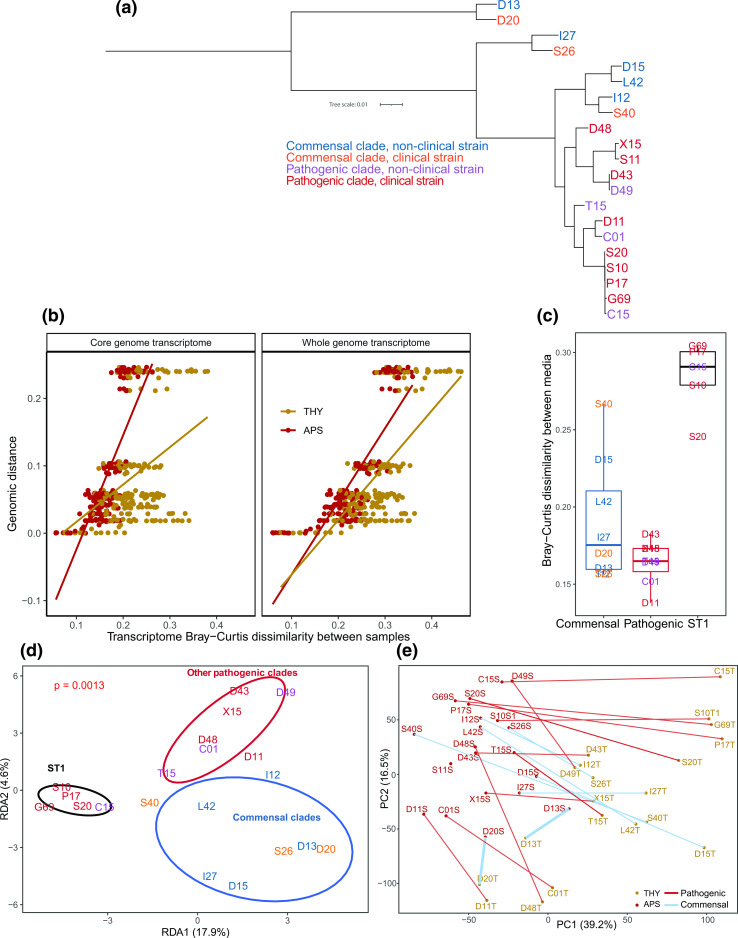
Fig. 1.
Strain phylogeny and overall transcriptome variation. (a) Core genome phylogenetic tree of the 21 strains included in the study, constructed by Orthofinder and STAG with default settings and mid-point rooted. While ST1 pathogenic strains such as P1/7 and S10 are closely related, commensal clades have high genomic diversity. (b) Transcriptome Bray–Curtis dissimilarity between strains correlates with genome phylogenetic distance. The transcriptome is more conserved in APS than in THY. Each point represents a pairwise comparison. Strains were only compared within the same medium. (c) Boxplot of core genome transcriptome Bray–Curtis dissimilarity between samples from each strain in the two media. (d) Redundancy analysis (RDA) on log2 (fold change) on the core genome transcriptome constrained by (ST1 vs other pathogenic clades vs commensal clades) showed that ST1 clade strains had a distinct transcriptome change between media. Ellipses represent 75 % confidence level. (e) Principal component analysis (PCA) showing core genome transcriptome separation between samples grown in THY and APS. The pairs of samples were well separated on PC1 in all strains except for strains D13 and D20. Each point (coloured by medium) is one sample, and the two samples of each strain are joined by lines coloured by clade type.

