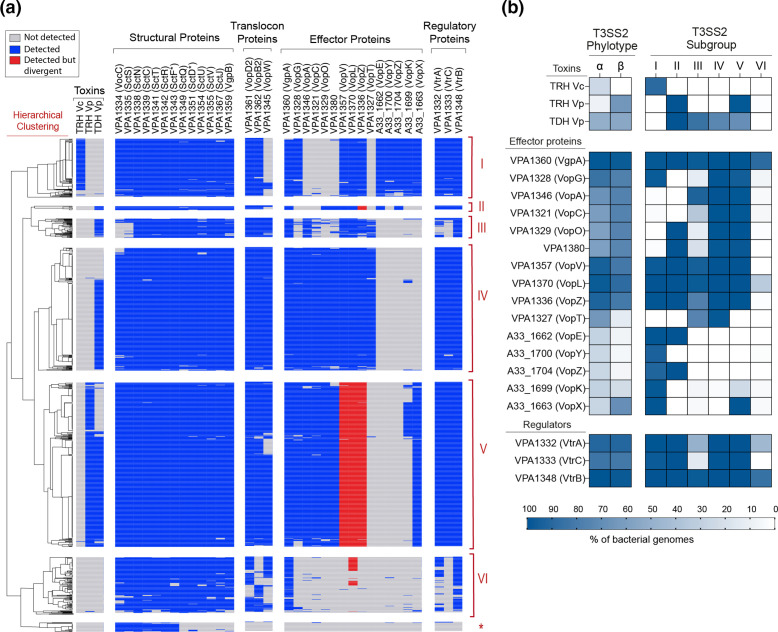
Fig. 6.
Hierarchical clustering analysis of T3SS2-related genes identifies six distinct subgroups. (a) Clustering analysis was performed using versatile matrix visualization and analysis software morpheus (one minus Pearson correlation, average linkage method). Boxes representing genes not detected, detected or detected but divergent (50–70 % amino acid sequence identity with at least 80 % sequence coverage) are coloured in grey, blue or red, respectively. An asterisk highlights the group of V. anguillarum genomes that only harboured a limited number of T3SS structural components. (b) Comparison of the frequency of detection of T3SS2 effector proteins, toxins and regulators between each T3SS2 phylotype and subgroup. Frequencies are colour coded and expressed as percentages.

