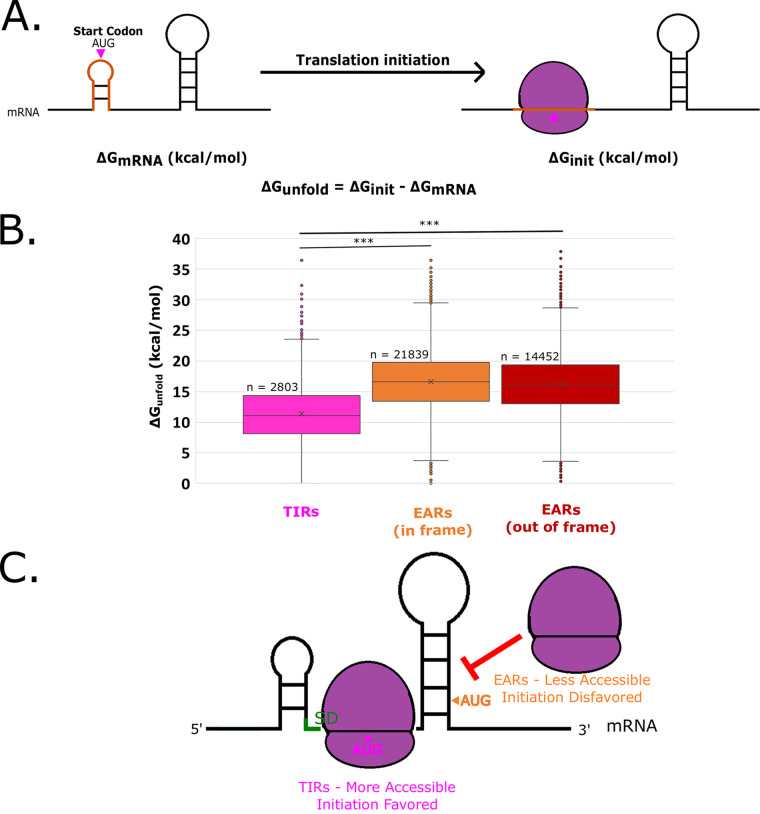
FIG 2.
EARs are less accessible than TIRs across the C. crescentus transcriptome. (A) mRNA accessibility can be estimated by the calculation of ΔGunfold. The predicted mRNA minimum free energy (ΔGmRNA) is represented on the left. The orange translation initiation region indicates a ribosome footprint surrounding the start codon (pink). The image on the right represents the mRNA upon initiation (ΔGinit), and the orange initiation region is unfolded by the ribosome. The ΔGunfold represents the amount of energy required to unfold the translation initiation region of the mRNA. (B) Box and whisker plot showing the distribution of ΔGunfold across all mapped TIRs and EARs in the C. crescentus transcriptome (20). The pink box and whiskers represent TIRs, whereas orange represents in-frame EARs and red represents out-of-frame EARs. *** indicates a P value of ≤0.001 for a two-tailed t test with unequal variances. (C) A graphical representation showing that TIRs are generally more accessible, thereby facilitating initiation, whereas EARs are less accessible, thereby blocking ribosome access.

