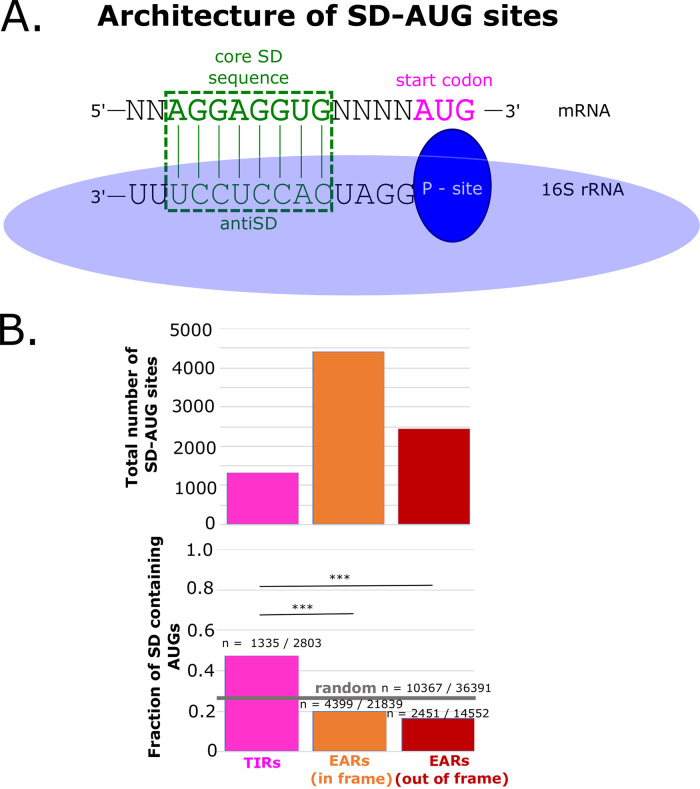
FIG 3.
SD-AUG pairs are more abundant in EARs than in TIRs. (A) A graphical representation of the optimal alignment of the core SD sequence “AGGAGGUG” in the mRNA shown in green, with the anti-SD sequence in the rRNA below. The base pairing is highlighted in the green dotted box. (B) The abundance of SD-AUG pairs across TIRs and EARs. The total number of SD-AUG pairs across TIRs and EARs is on the top. The pink bar represents the TIRs, whereas the orange bar represents the in-frame EARs and the red bar represents the out-of-frame EARs. Below is the fraction of SD enrichment in the TIRs and EARs. The random probability of SD enrichment is shown as a gray horizontal line (estimated from 36,391 random sequences of the 67% genomic GC% of C. crescentus). *** indicates a P value of ≤0.001, as calculated from a two-sample z test.

