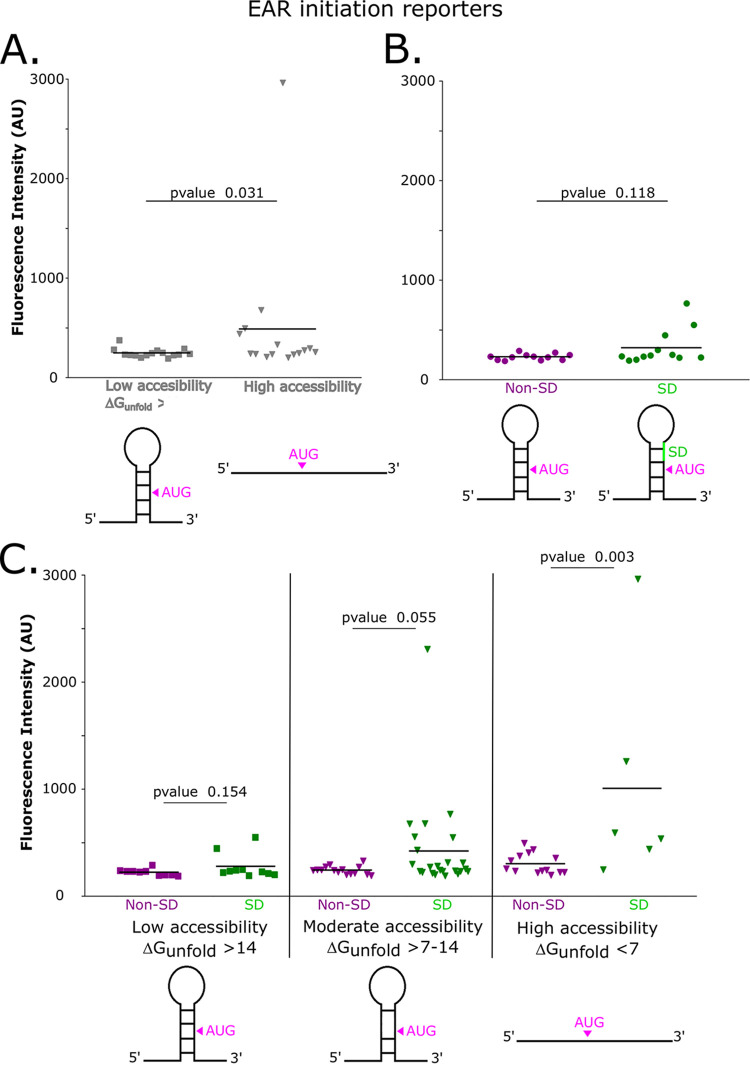
FIG 5.
Low EAR accessibility prevents the stimulation of initiation by SD sites. (A) Distribution plot showing the average YFP levels of nonaccessible wild-type EARs, which are represented by square data points, versus accessible mutant EARs, which are represented by inverted triangle data points. EAR mutants contain point mutations in the region upstream of the AUG, and these reduce potential base pairing in the EAR region. Each point represents a single EAR reporter construct’s in vivo YFP level (Table S2). A Mann-Whitney U test was calculated between low accessibility and high accessibility constructs to assess significance. (B) Distribution plot showing the average YFP level of non-SD EARs, which are represented by dark magenta data points, versus SD EARs, which are represented by green data points. A Mann-Whitney U test between the non-SD and SD EAR initiation reporters was used to assess significance. (C) Distribution plot showing the average YFP of non-SD and SD TIRs with different degrees of accessibility. Dark magenta data points represent non-SD TIRs, and green data points represents SD TIRs. Squared data points represent low accessibility TIRs, and inverted triangle data points represent moderately accessible and highly accessible TIRs. A Mann-Whitney U test was performed for the non-SD and SD pairs in each accessibility category to compare the skewed distributions for significance.

