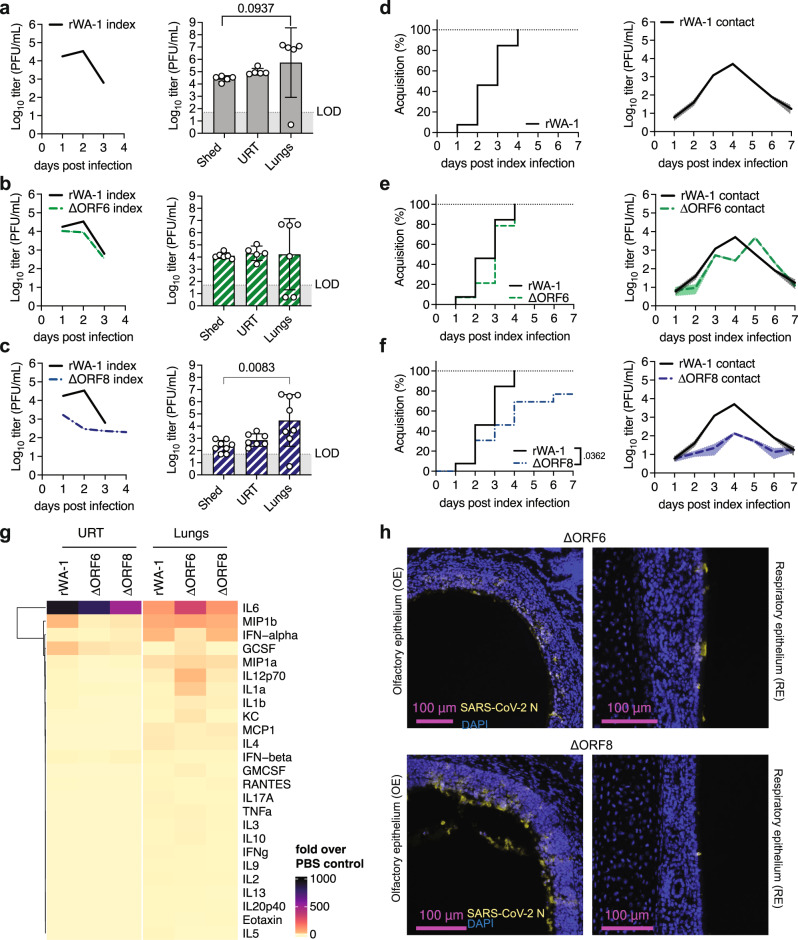
Fig. 4. Recombinant SARS-CoV-2 ORF6 and ORF8 replication dynamics, tropism, transmission, and cytokine profiles.
Neonatal K18-hACE2+/- mice were intranasally infected with 1500 PFU of recombinant WA-1 (rWA-1), rWA-1 lacking ORF6 (ΔORF6), or rWA-1 lacking ORF8 (ΔORF8). a-c Viral burden in daily shedding samples (left) and in 2 dpi shedding samples, upper respiratory tract (URT) and lungs (right). Data from at least n = 5 pups per group. d-f Percentage of viral acquisition shown in inverted Kaplan-Meier plots and viral infectious burden in contact shedding samples, shown as geometric mean (line) with geometric standard deviation (shaded area). Data from at least 2 independent repetitions with n = 1 index and 4-6 contacts each. a-f Only significant p-values (Mantel-Cox Log-rank test for Kaplan-Meier plots, Kruskal-Wallis test for viral burden) are presented. Individual values below the limit of detection (LOD, 50 PFU/ml) were set to 5. g Heatmap representing cytokine levels at 2 dpi in retrotracheal lavages and lungs measured by multiplex ELISA. Data represent -fold induction over PBS-inoculated pups. At least n = 3 pups per condition. h Immunohistochemistry for SARS-CoV-2 N at 2 dpi in nasopharynx.

