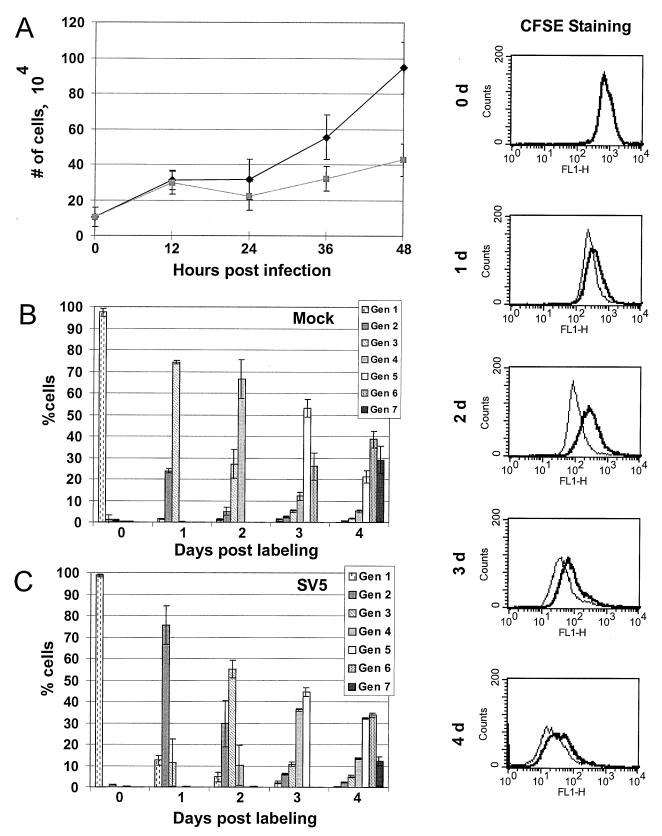
FIG. 1.
Cell growth and proliferation in SV5-infected and mock-infected cells. (A) Cell growth assay. Equal numbers of HeLa T4 cells were either mock infected (⧫) or SV5 infected ( ) and then harvested at 12-h intervals, and the cells were counted. Each time point represents the average of three separate plates of cells. (B and C) Proliferation assay. HeLa T4 cells were either mock infected or SV5 infected and then labeled with 50 μM CFSE. At various times after labeling, cell were harvested by trypsinization, fixed in paraformaldehyde, and analyzed by flow cytometry. Primary data are shown in side panels: thick line, SV5-infected cells; thin line, mock-infected cells. (B and C) Computed data for mock-infected cells (B) and SV5-infected cells (C). With each successive generation of cells the amount of label in each cell decreases. Cell generations were modeled using the Proliferation Wizard algorithm of the ModFIT LT program. Averaged data from three plates of cells for each time point are presented.

