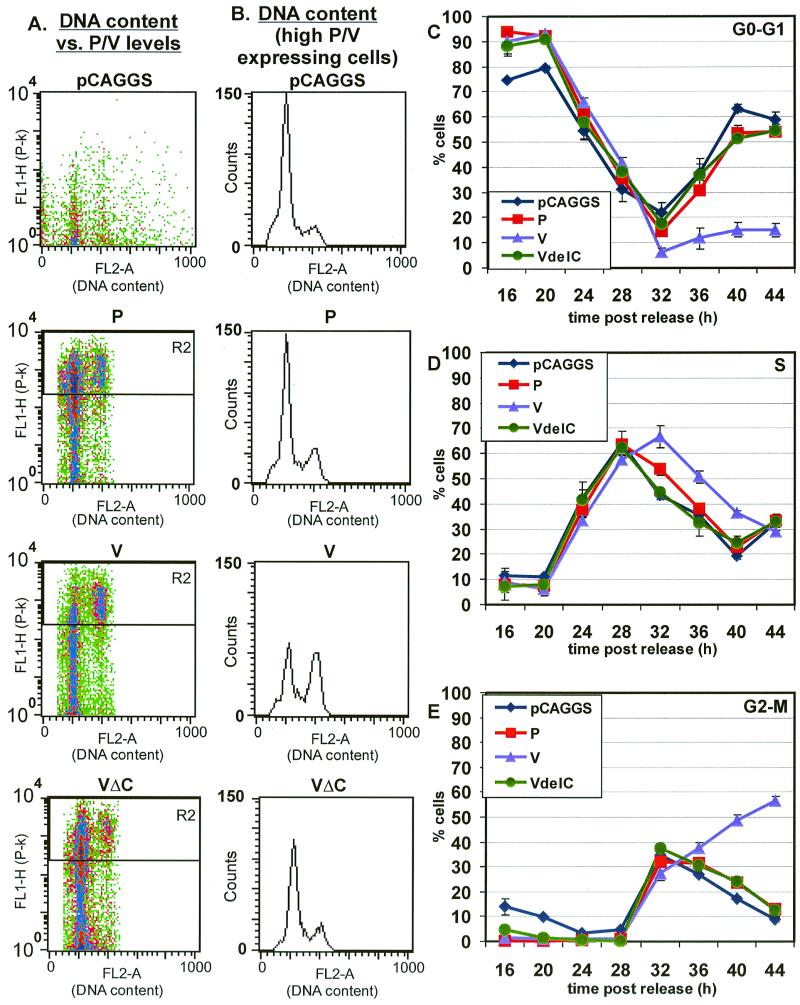
FIG. 6.
Cell cycle analysis of HeLa T4 cells expressing P, V, or
VΔC proteins. HeLa T4 cells were synchronized as described in the
legend to Fig. 2. After release from the G1-S-phase block,
cells were transfected with 2 μg of the following plasmids: pCAGGS,
pCAGGS-P, pCAGGS-V, or pCAGGS-VΔC. The cells were treated and
analyzed as described in the legend for Fig. 3. The population of cells
expressing high levels of V protein were selected for analysis. (A) The
panels show representative flow cytometry data at the 44-h time
point. The density plots graph DNA content (FL2-A) versus the level of
P or V protein expression (FL1-H). The density plots show the selection
of the high-expressing population of transfected cells (gate R2). (B)
The DNA content (FL2-A) histograms of the high-expressing population of
cells at 44 h post-release of synchronization block are shown. (C,
D, and E) The percentage of cells in G0-G1
phase (C), S phase (D), and G2-M phase (E) are shown. Each
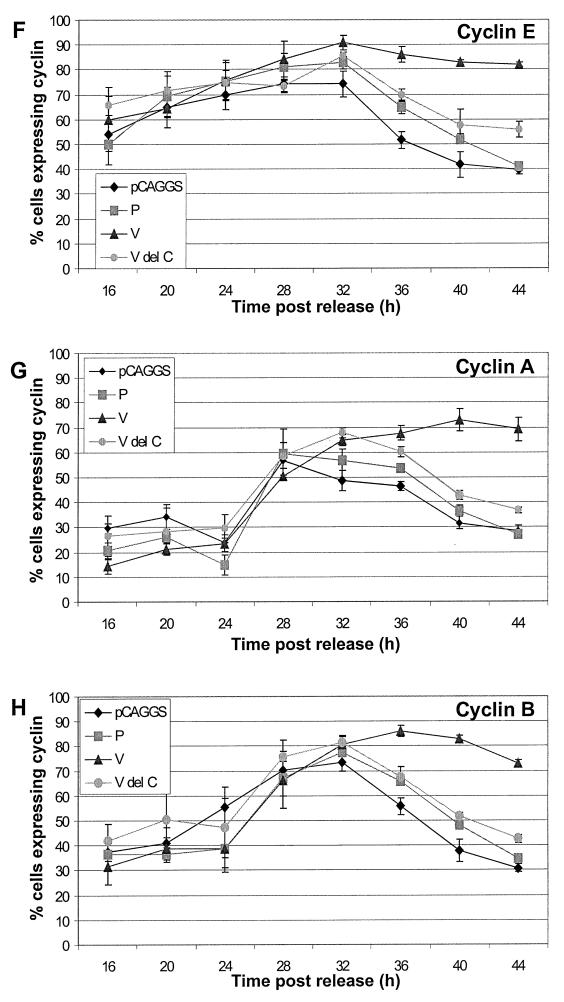
time point is the average of three plates of cells. (F, G, and H) Cell
cycle analysis and cyclin expression for HeLa T4 cells expressing P, V,
or VΔC. Cells were treated as described in the legend for Fig. 2.
Each time point represents the average of three plates of cells.
Symbols: ⧫, control vector-transfected cells;
, P-expressing
cells; ▴, V-expressing cells;
 ,
VΔC-transfected cells.


