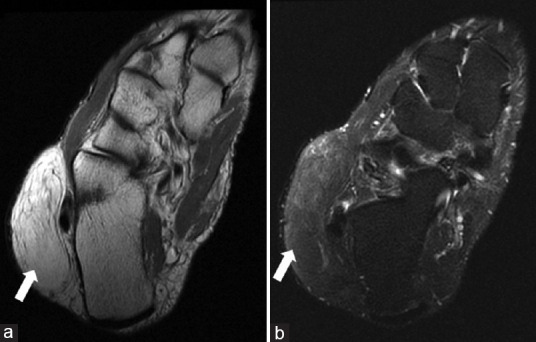
Figure 5.

Lipoma (a) Axial PD, and (b) Axial T2 fat-saturated MRI demonstrating a well-defined soft tissue mass lesion within the subcutaneous soft tissues at the lateral aspect of the hindfoot demonstrating hyperintense signal on the PD sequence (arrow) with complete saturation of signal on the fat saturated image (arrowhead) compatible with fat signal. There are few thin internal septations, however no mural soft tissue nodularity. PD: Proton density, MRI: Magnetic resonance imaging
