
Figure 3.
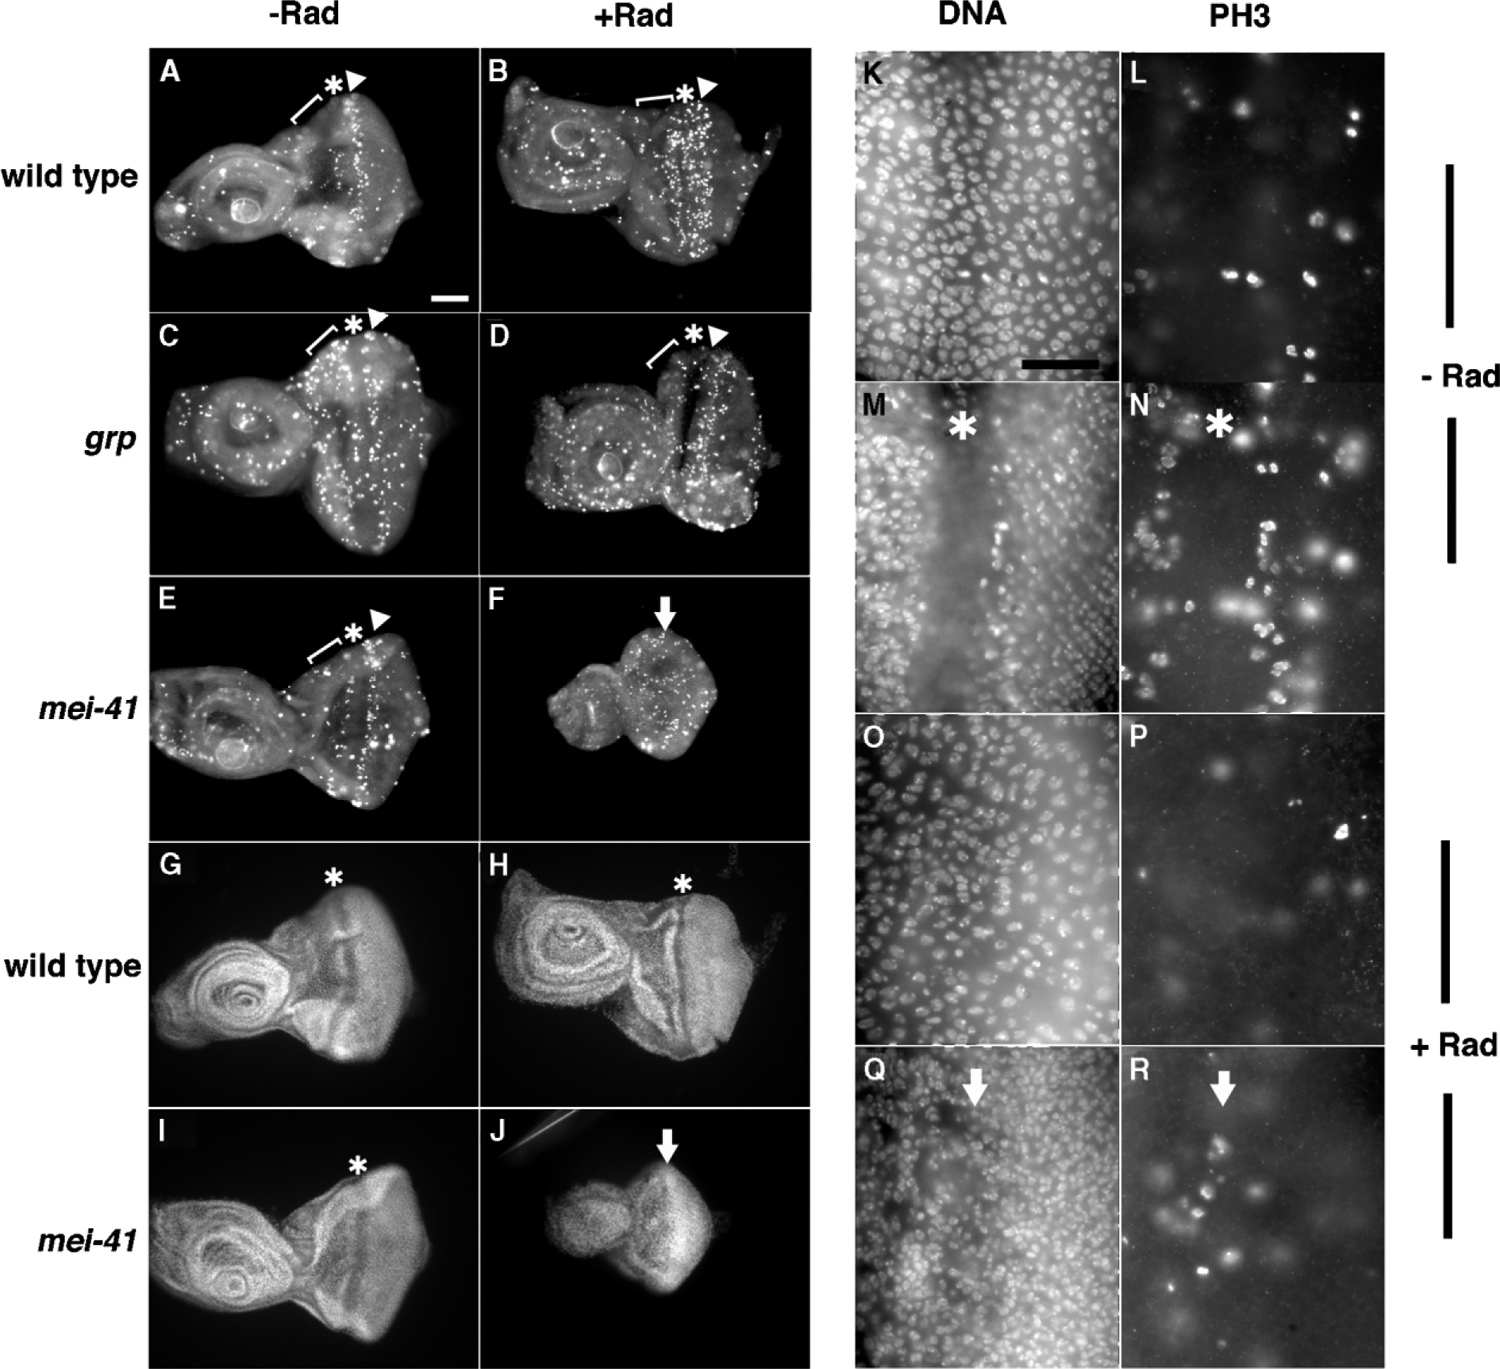
Mitosis, Disc Morphology, and Size after Irradiation
Third instar larvae were irradiated with 0 (−RAD) or 2000 Rads (+RAD) of X-rays. Discs were extirpated at 24 hr after irradiation, fixed, and stained for PH3, a marker for mitosis [42](A–F, L, N, P, and R) and DNA (G–J, K, M, O, and Q). The first (bracket) and second (arrowheads) mitotic waves, and MF (*) are indicated. The arrows indicate the presumptive location of the MF, which is absent in irradiated mei-41 discs (F, J, Q, and R). Anterior is to the left. Scale bar: 60 μm (A–J) or 15 μm (K–R). Genotypes are as indicated in (A)–(J); (K)–(R) are of mei-41 mutants.
(K–R) Higher magnification images show reduced proliferation in both cell layers of irradiated mei-41 discs, oriented as in (A)–(F); (K) and (M) are different focal planes of the same disc region that show peripodial (K) and columnar (M) layers. (L) and (N) show PH3 stain that corresponds to (K) and (M), respectively. (O) and (Q) are different focal planes of the same disc region that show peripodial (O) and columnar (Q) layers. (P) and (R) show PH3 stain that corresponds to (O) and (Q), respectively. An asterisk (*) indicates MF in (M) and (N). Arrow indicates presumptive MF in (Q) and (R). mei-41 controls (K–N) show mitoses in both peripodial (L) and columnar (N) cell layers. In contrast, irradiated mei-41 discs show few PH3 cells in both the peripodial (P) and columnar (R) cell layers; in particular, the second mitotic wave, which should reside just posterior to the MF, is absent in (R).