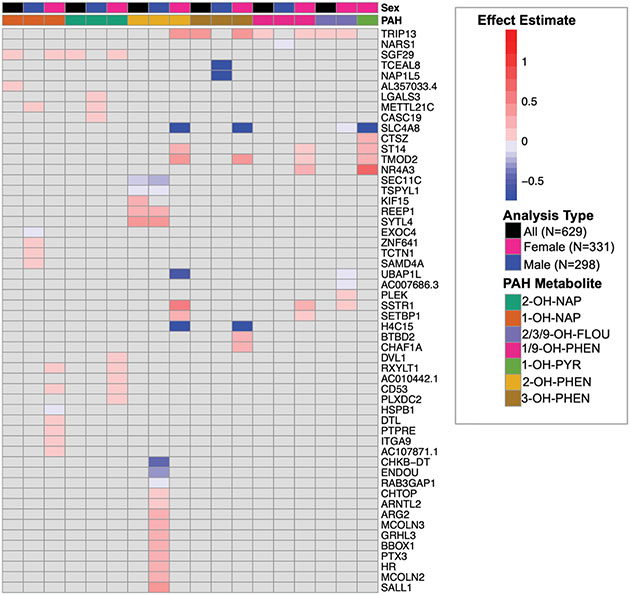
Fig. 3.
Effect estimates (log CPM/[ng/ml]) of fully adjusted model for all analyses (overall and sex-specific) that were statistically significant, which are presented in Table 2 and Supplemental Table 6. As noted in the figure legend, the top 2 bars of the heatmap depict OH-PAH metabolite and the model type (primary = black, female stratified = pink, male stratified = blue). Within the heatmap, the color of the box represents the magnitude of the effect estimate, with positive associations between OH-PAH metabolite concentration and placental gene expression depicted in red, and negative associations depicted in blue. Only genes/OH-PAH relationships that are statistically significant (FDR adjusted P < 0.05) are depicted. Relationships that were not statistically significant are depicted in grey.

