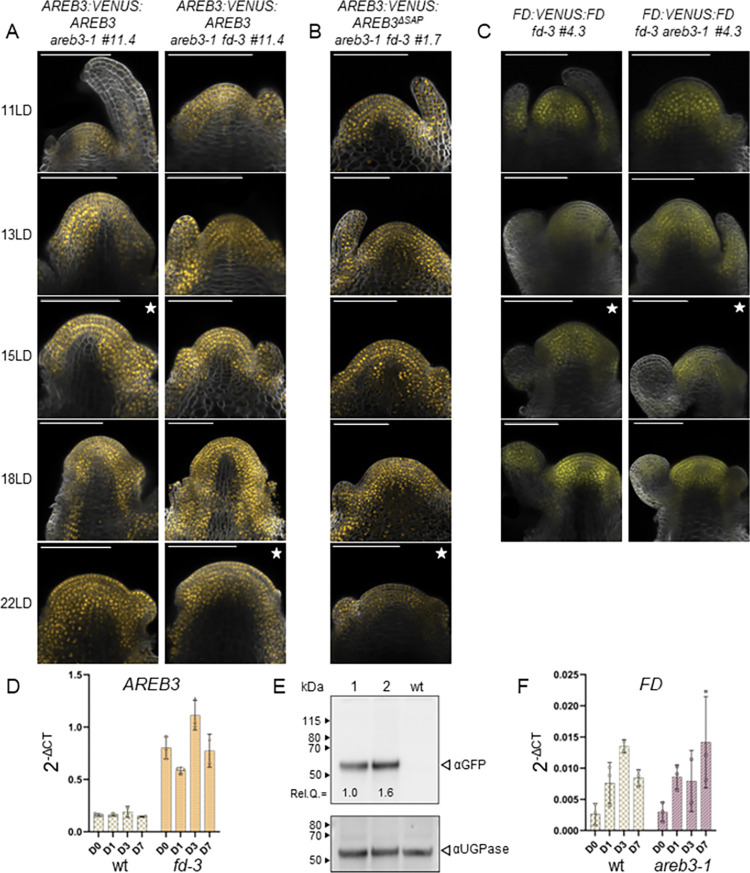
Fig 3. Gene expression and protein localisation of AREB3 and FD.
(A) Confocal analysis of dissected apices during the floral transition of pAREB3:VENUS:AREB3 in areb3-1 and areb3-1 fd-3 backgrounds. (B) Dissected apices of pAREB3:VENUS:AREB3ΔSAP in areb3-1 fd-3 were analysed by confocal microscopy. (C) Confocal analysis of dissected apices of pFD:VENUS:FD in fd-3 and fd-3 areb3-1 backgrounds. In these assays, at least three apices of each line were analysed and a representative image of the spatial distribution of the proteins was selected. The star indicates the establishment of the inflorescence meristem. Scale bars, 100 μm. (D) mRNA levels of AREB3 in wt and the fd-3 mutant in SAM-enriched tissue. (E) AREB3:VENUS protein abundance in SAMs of areb3-1 (lane 1) and areb3-1 fd-3 (lane 2) isogenic lines #11.4. Upper panel: immunoblot analysis of AREB3:VENUS detected with αGFP antibodies; Rel. Q. indicates protein quantity relative to the sample loaded in lane1. Lower panel: immunoblot analysis of UGPase, used as a loading control. For each panel, numbers indicate molecular weights. (F) mRNA levels of FD in wt and areb3-1 mutant in SAM-enriched tissue. In both experiments, Arabidopsis plants were grown for two weeks in short-day (SD) conditions and then shifted to long days (LD). Samples were harvested at ZT8 before the shift (D0) and 1, 3, and 7 days (D1, D3, and D7, respectively) after the shift to flowering-inducing photoperiod. Each point represents an independent pool of around five meristems. The experiment was performed twice with similar results.

