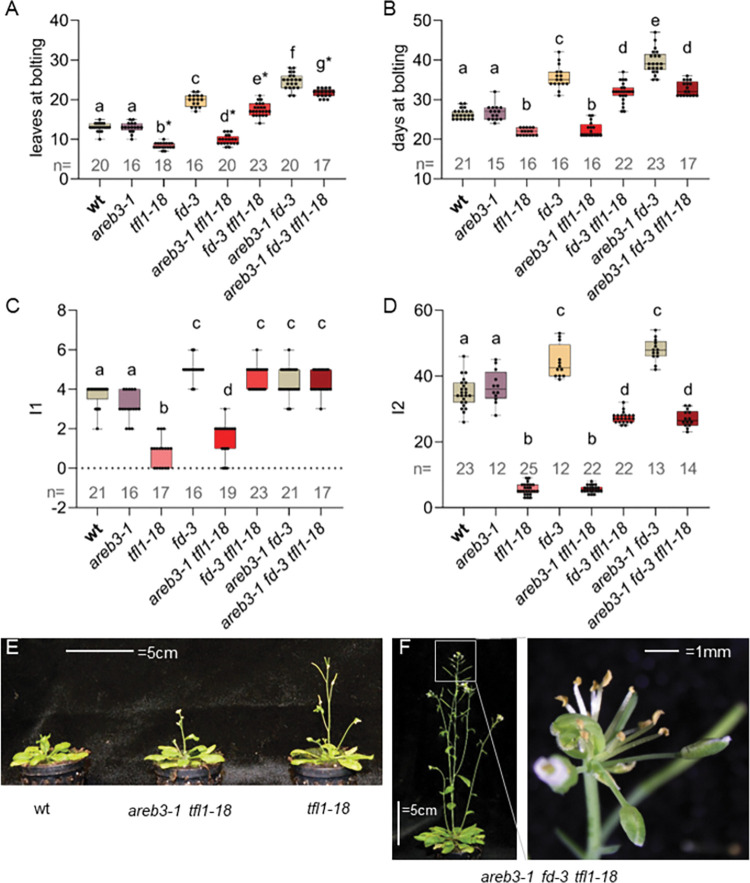
Fig 6. Genetic interaction between AREB3, FD, and TFL1.
(A) Flowering time of the indicated genotypes under LDs. Asterisks indicate a terminal flower on the main inflorescence. Significance a vs b p = 1e-14; a vs c p 1e-15; a vs d p<5.07e-10; b vs d p = 0.031; a vs e p = 2e-15; c vs e p = 3.15e-05; e vs g p = 2,1e-14; f vs g p = 2.44e-08. (B) The flowering time of the genotypes indicated in A expressed in the number of days between sowing and bolting. Significance a vs b p = 1.37e-7; a vs c p = 1.2e-14; b vs d p = 1.0e-14; c vs e p = 9.91e-6; d vs e p<9.0e-14. (C) Mean number of cauline leaves on the main inflorescence of the indicated genotypes under LDs. Significance a vs b p<1e-15; a vs c p<0.032; b vs c p<1e-15; b vs d p = 0.041. (D) Mean number of floral nodes on the main inflorescence. Significance a vs b p<5e-14; a vs c p<1.44e-6: b vs d p = 5e-14. (E) The phenotype of the indicated genotypes at 3 weeks after sowing under LDs. areb3-1 tfl1-18 bolted slightly later than the tfl1-18 mutant and presented at least one cauline leaf subtending an inflorescence-like structure. (F) The phenotype of the indicated genotypes at 6 weeks after sowing under LDs. areb3-1 fd-3 tfl1-18 rescued almost all the inflorescence defects of tfl1-18 but still presented a terminal flower on the main inflorescence (inset).

