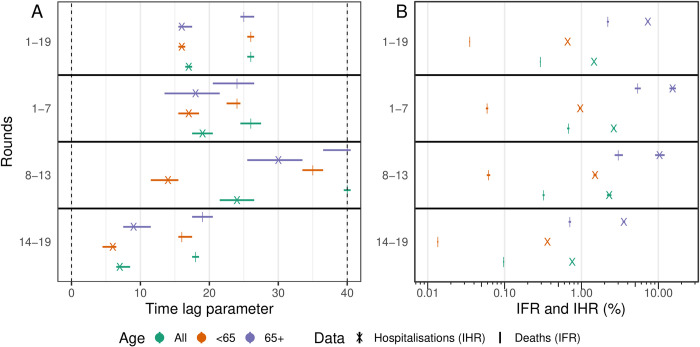
Fig 1. Comparison of parameters obtained by fitting to different subsets of the REACT-1 data.
(A) Best-fitting time-lag parameter and 95% credible intervals for models fit to deaths (cross, time-lag between swab positivity and deaths) and hospitalisations (vertical line, time-lag between swab positivity and hospitalisations), for models fit to all age-groups (green), those aged 64 years and under (orange), and those aged 65 years and over (purple). (B) Best-fitting scaling parameter and 95% credible intervals on a log10 x-axis for models fit to deaths (cross) and hospitalisations (vertical line), for models fit to all age-groups (green), those aged 64 years and under (orange), and those aged 65 years and over (purple). All numerical values are provided in S1 Table.

