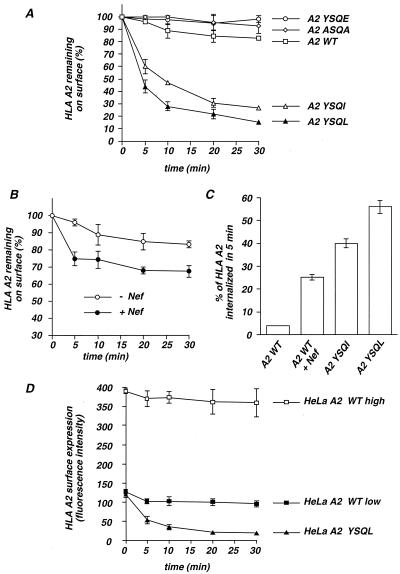
FIG. 4.
Effect of prototypic sorting signals and of Nef on the internalization of HLA-A2. (A) Kinetics of internalization of A2 WT and mutants. HeLa cells were transfected with 4 μg of the indicated A2 vectors and 0.5 μg of GFP vector. After 24 h, cells were labeled at 4°C with an anti-HLA-A2 MAb (MA2.1), washed, and incubated at 37°C for the indicated periods of time. Cells were then cooled at 4°C and stained with fluorescent antimouse IgG antibodies. Data are the ratio of the MF at different time points to the value obtained at time zero (400 U for A2 WT, A2 ASQA, or A2 YSQE and 130 U for A2 YSQI and A2 YSQL). Results from three independent experiments (mean ± standard deviation) are shown. (B) Kinetics of internalization of A2 WT in the absence or presence of Nef. HeLa cells were transfected with 4 μg of A2 WT, 12 μg of Nef or Nef-mock vector, and 0.5 μg of GFP vector. Analysis was performed as described for panel A. The surface levels of A2 WT were 400 and 130 fluorescence units, in the absence or presence of Nef, respectively. Results from three independent experiments (mean ± standard deviation) are shown. (C) Comparative analysis of A2 YSQI, A2 YSQL, and Nef-induced HLA-A2 internalization. Internalization rates of HLA-A2 were measured in HeLa cells as described for panels A and B. The 5-min time point is depicted. Results from three independent experiments (mean ± standard deviation) are shown. (D) Kinetics of internalization of HLA-A2 in HeLa clones expressing different steady-state surface levels of A2 WT or A2 YSQL. Independent HeLa clones stably expressing either high (HeLa A2 WT high, 400 U after staining with the MA2.1 anti-HLA A2 MAb) or low (HeLa A2 WT low, 120 U) levels of HLA-A2 WT or expressing A2 YSQL (HeLa A2 YSQL, 120 U) were isolated. Internalization of HLA-A2 was then measured as described above, except that data are presented as the fluorescence intensity of HLA-A2 staining at the indicated time points. For each cell type, results are the mean ± standard deviation of two independent clones.

