Fig. 9.

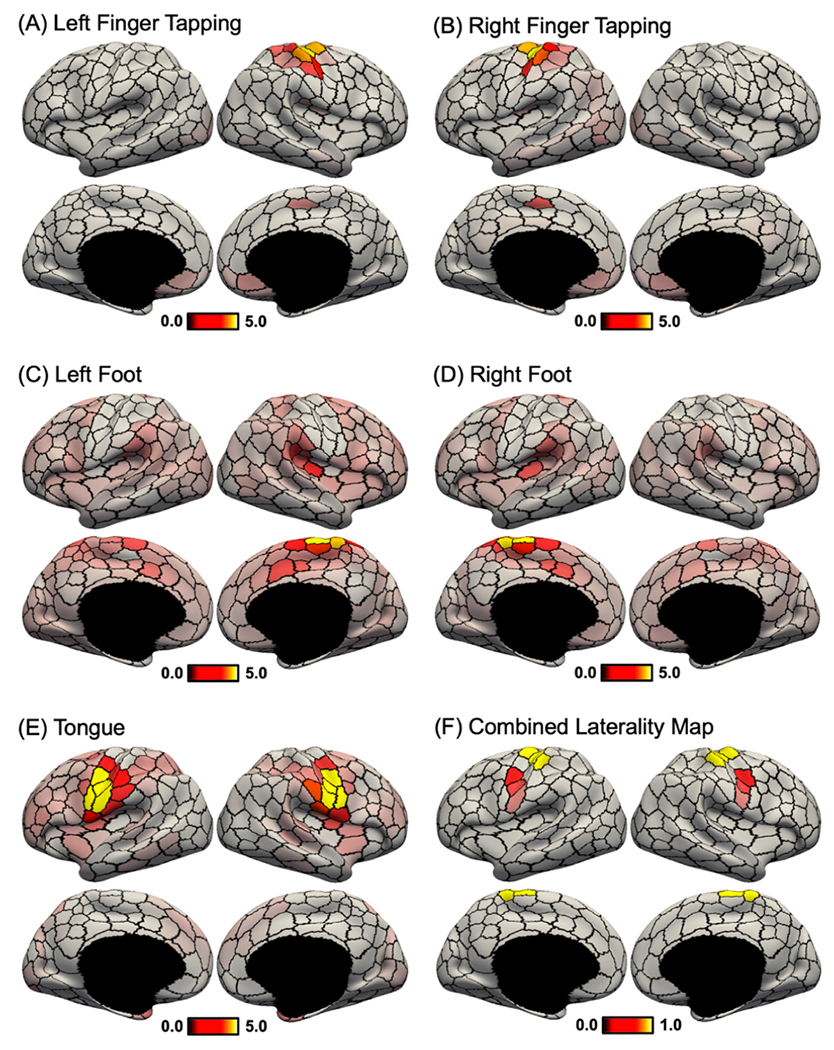
Motor task activation lateralization in the HCP dataset. (A) Group-average “left finger – average” motor task contrast. Activation z values were averaged within each of the 400-region hMRF cortical parcellation (shown as black boundaries). (B) Group-average “right finger – average” motor task contrast. (C) Group-average “left foot – average” motor task contrast. (D) Group-average “right foot – average” motor task contrast. (E) Group-average “tongue – average” motor task contrast. (F) Task laterality map averaged across the five contrasts. Similar to Fig. 8, task laterality was defined as the absolute difference between left and right hemisphere activation values. Laterality was only computed for parcels whose average activations were at least 70% of the most activated parcel (number of suprathreshold parcels = 16). Laterality maps for alternative thresholds can be found in Fig. S14. There was a negative correlation between task activation laterality (Fig. 9F) and SNR-regressed homotopic correlations (Fig. 8D).
