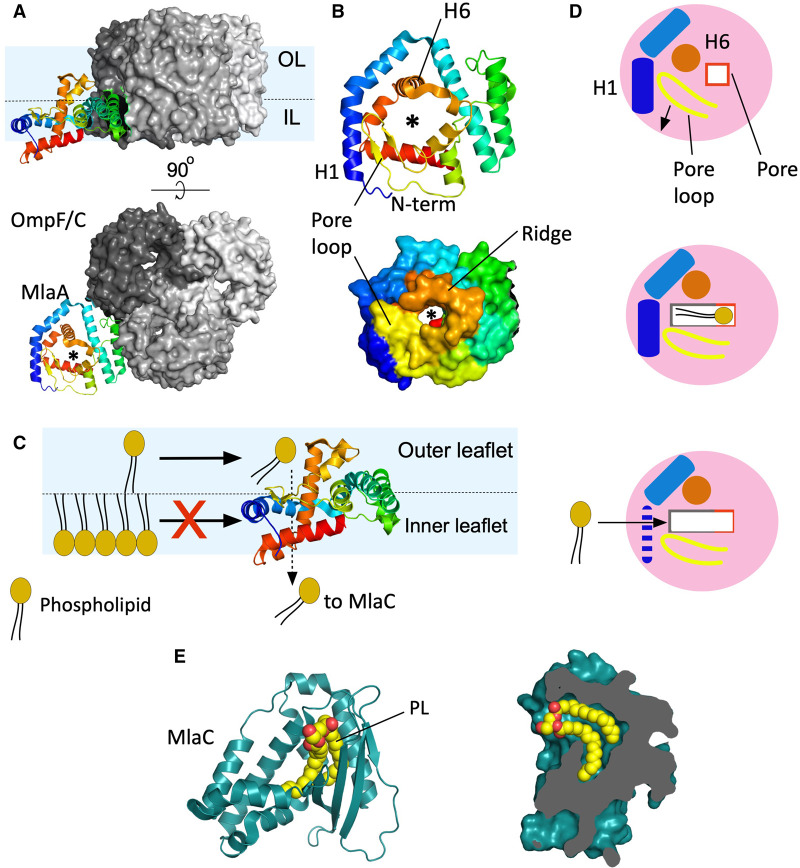
Figure 3. The MlaA–OmpC/F complex and MlaC.
(A) Representation of a MlaA–OmpF/C complex from the OM plane (top panel) and viewed from the outside of the cell (bottom panel). The schematic representation of MlaA is in rainbow colouring (N-terminus; blue). The surface model of OmpF/C trimers shows each monomer in a different shade of grey. The asterisk indicates the MlaA channel. The inner leaflet (IL) and outer leaflet (OL) of the OM are separated by a dashed line in the top panel. (B) Exterior view of MlaA (schematic representation and surface view, top and bottom panels, respectively). The most significant structural elements have been labelled. (C) Diagram showing the proposed retrograde transport mechanism for MlaA viewed from the OM plane. Helices around the central channel, resembling a donut, are blocking the access of PLs from the inner leaflet into the pore while PLs located in the outer leaflet have access to the channel and are transferred to MlaC. (D) Schematic view of MlaA from the outside of the cell. Top panel represent the crystal structure, the hydrophilic pore is shown as a red line square. The arrow indicates the direction of the structural rearrangement needed to open up the pore. Middle panel, diagram of the open state in which the pore is enlarged and the hydrophobic region of the channel (grey line) is exposed. For clarity only helices 1 and 6 are represented and labelled. Pore loop in yellow. Bottom panel, proposed disruption of H1 in mutant mlaA* allowing direct access of PLs from the inner leaflet into the channel. (E) Left, schematic representation of MlaC (aquamarine-blue) with a PL bound (in yellow and red). Right, slice of a surface representation of MlaC showing the hydrophobic pocket with a PL bound.

