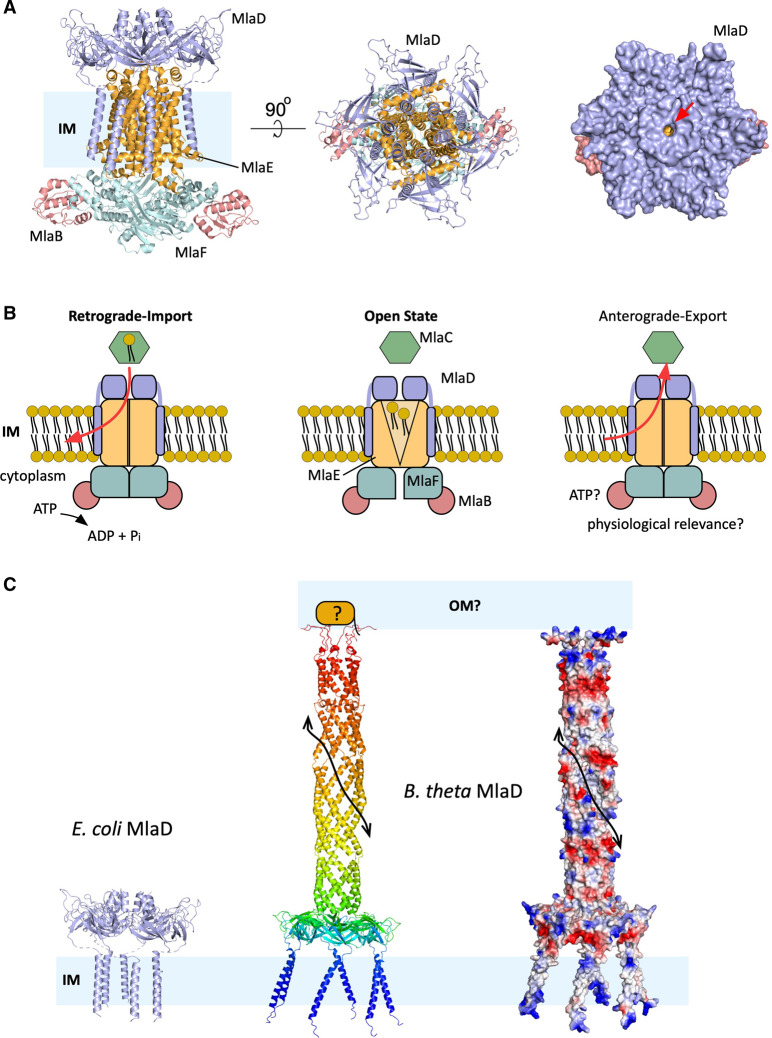
Figure 4. Overview of the MlaFEDB complex.
(A) Representation of the MlaFEDB complex from the IM plane and periplasm view (left and middle panels). Surface view of the complex from the periplasm, right panel. The red arrow shows the hydrophobic channel. (B) Schematic diagrams showing the open complex state and the two possible transport directions. For clarity the colour code has been maintained in A and B. (C) Representation of E. coli MlaD compared with the AlphaFold model predicted for B. theta. The middle panel shows a rainbow coloured representation (blue, N-terminus) and the right panel shows the electrostatic surfaces (−53 kT e−1 to 53 kT e−1) of the predicted structure (negative residues in red, positive in blue). The potential interaction site with the OM and the predicted structure is shown. The possibility of an unknown associated OM lipoprotein is depicted. The black arrow shows the portion of the channel groove. For clarity, the remainder of the ABC transporter is not shown.

