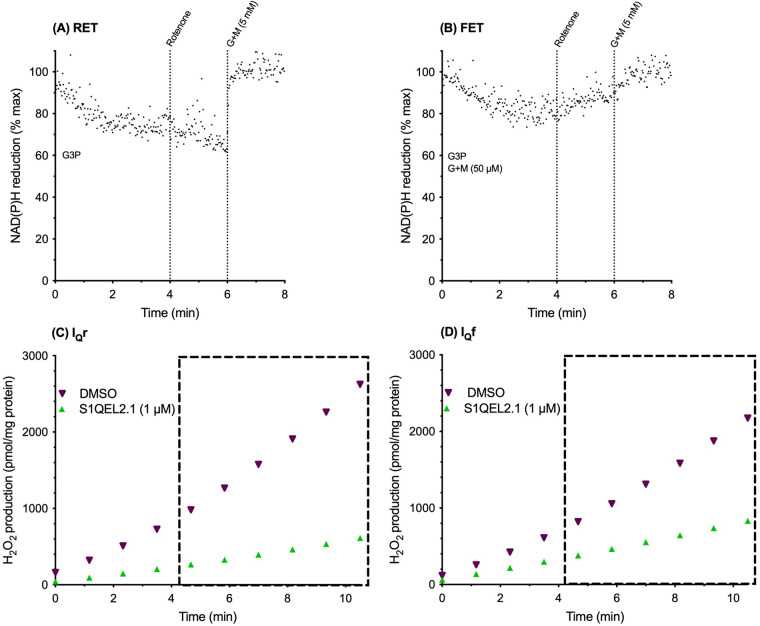
Figure 3. Reverse and forward electron transport through complex I in muscle mitochondria in cuvette-based assays using plate-reader timings; parallel superoxide/hydrogen peroxide production from sites IQr and IQf and its suppression by S1QELs in the plate-reader.
(A,B) Cuvette-based assays with plate-reader timings of NAD(P)H autofluorescence, with 0% reduction taken as the average autofluorescence signal of all runs on the same day at 5 min under the conditions of Figure 2A,B and 100% reduction taken as the steady value in each trace after addition of 5 mM glutamate plus malate (G + M). (A) Reverse electron transport achieved by adding 12.5 mM glycerol 3-phosphate as sole substrate at t = 0 and demonstrated by oxidation of the matrix NAD pool upon challenge with 4 µM rotenone at 4 min; (B) forward electron transport achieved by adding 50 µM glutamate plus malate and 12.5 mM glycerol 3-phosphate as additional substrate at t = 0 and demonstrated by reduction of the matrix NAD pool upon challenge with 4 µM rotenone at 4 min. (C,D) Plate-reader assays of superoxide/hydrogen peroxide production from site IQr during reverse electron transport (C), and from site IQf during forward electron transport (D), measured between ∼4 min and 11 min (dotted boxes) using the Amplex UltraRed assay with DMSO or 1 µM S1QEL2.1 in DMSO added at t = 0. Resorufin fluorescence was calibrated using known additions of standard hydrogen peroxide; 2 µM atpenin A5 and 10 µM S3QEL3 were also added. Traces are representative of duplicates each day and at least three repeats on independent mitochondrial preparations.

