. 2023 May 5;12:e82376. doi: 10.7554/eLife.82376

Figure 4. Sexual dimorphism in C57BL/6J.

(A) Distribution of volume (left), density (middle), and cell count (right) for the whole brain gray matter (‘gray’) in female (dark green), and male (light green). p-Values correspond to a rank-sum test. Step-like dashed lines represent histograms while full lines correspond to kernel estimations of the probability density function. Dispersion values correspond to standard deviations. (B) Volcano plots showing per-region statistical testing for male versus female difference in volume (left), density (middle), and cell count (right), each dot representing one region. Horizontal axis, median differences (%); vertical axis, q-values (FDR-corrected rank-sum p-values by BH procedure in -log10 scale). Red dots highlight regions with an effect size larger than 5% and q < 0.01. Source data for this panel is provided in Figure 4—source data 1. (C) Examples of regions that display sexually dimorphic volume and/or density. Distributions of volumes appear in the upper row, distributions of densities in the lower row.

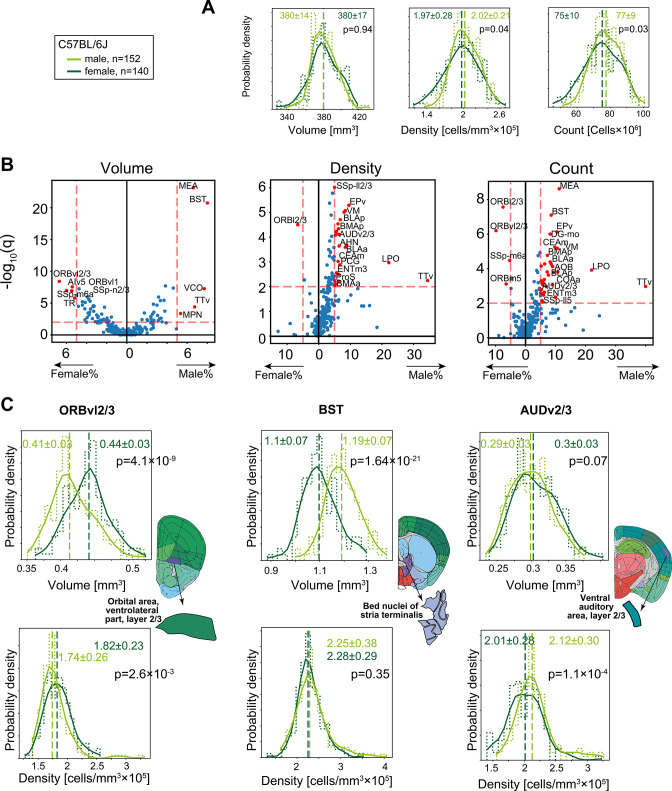
Figure 4—source data 1. Median values per region for cell count, volume and cell density for male and female C57BL/6J or FVB.CD1.

Figure 4.

Figure 4—figure supplement 1. Validation and additional aspects of sexual dimorphism.

Figure 4—figure supplement 1.

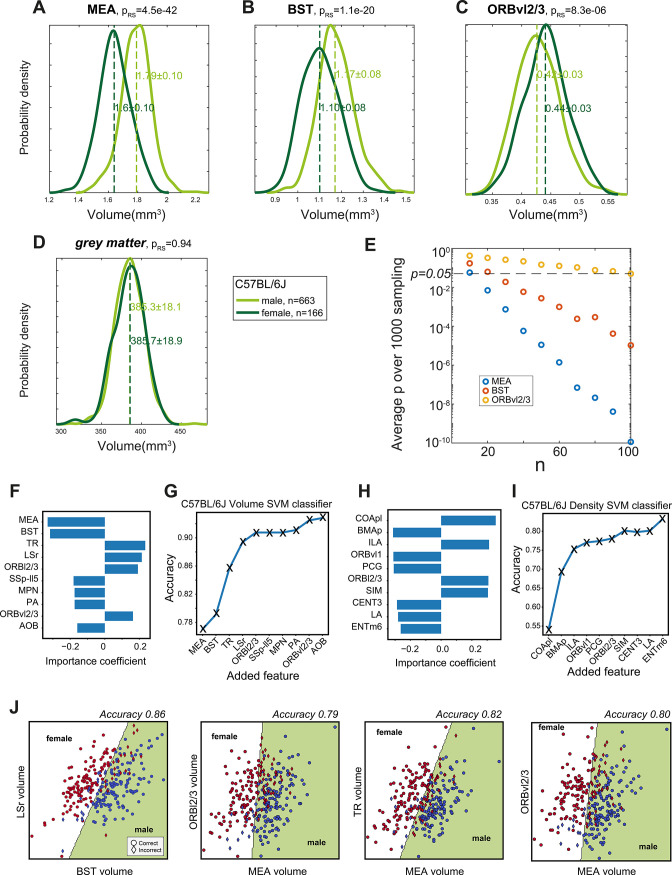
(A–D) Independent validation of region-specific sexual dimorphism in C57BL/6J. Using data from an independent cohort of 663 males vs. 166 females, we display the volume distributions of regions found to display dimorphism in our basic cohort – medial amygdala (MEA) (A), bed nuclei of the stria terminalis (BST) (B), and ORBvl2/3 (C). Also shown is the similarity between whole-brain volumes (D). p-values are based on a rank-sum test. (E) The average p-value for sexual dimorphism in MEA (blue), BST (red), and ORBvl2/3 (blue) as a function of sample size. Specifically, n males and n females from our cohort were randomly selected and the rank-sum p-value was calculated. Shown is the average p-value over 1000 such random selections. (F) Top 10 regions when constructing a linear support vector machine (SVM) volume-based classifier. (G) Accuracy of volume-based classifiers when using the top 10 regions, adding one region at the time. (H, I) Same as (E, F) but for density-based classifiers. (J) Four examples of two-dimensional SVM based on volume information, as indicated on x and y axes; with accuracies indicated above. The separating line splits the plane into female/male domains. Red/blue markers represent individual males and females, respectively. Circles and diamonds represent correct and incorrect classifications, respectively.