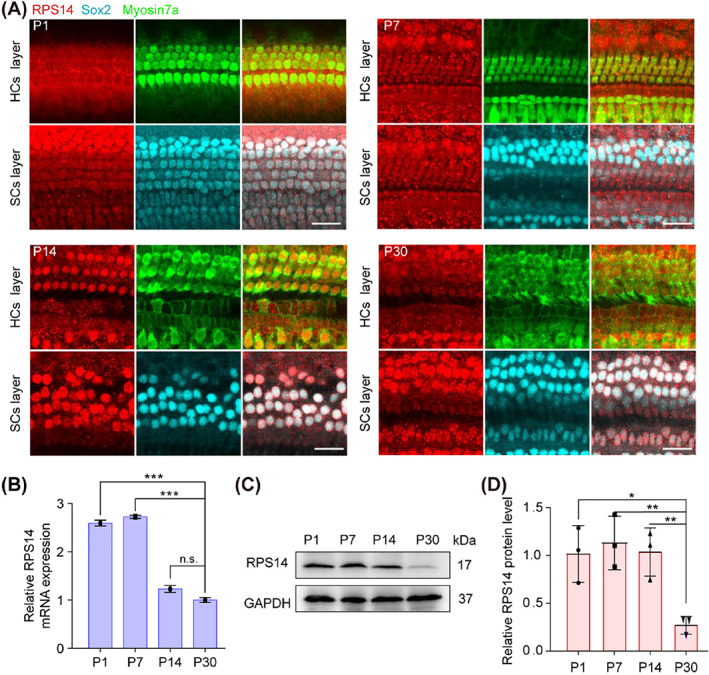
FIGURE 1.

The expression of Rps14 in the mouse cochlea. (A) Immunostaining for RPS14 (red) in cochlear epithelia from P1, P7, P14 and P30 mice. Myosin7a (green) marks HCs and Sox2 (cyan) marks SCs. Scale bars: 25 μm. (B) The QPCR analysis of Rps14 mRNA expression in cochleae from P1, P7, P14 and P30 mice (n = 3). (C) Immunoblots for RPS14 in cochleae from P1, P7, P14 and P30 mice. (D) Normalised RPS14 protein levels in (C) (n = 3). Results are shown as the mean ± SEM. The p‐value was calculated by one‐way ANOVA with Tukey's multiple comparison test (*p < 0.05; **p < 0.01; ***p < 0.001; n.s. refers to no significance). ANOVA, analysis of variance; HCs, hair cells; SCs, supporting cells; QPCR, quantitative real‐time polymerase chain reaction.
