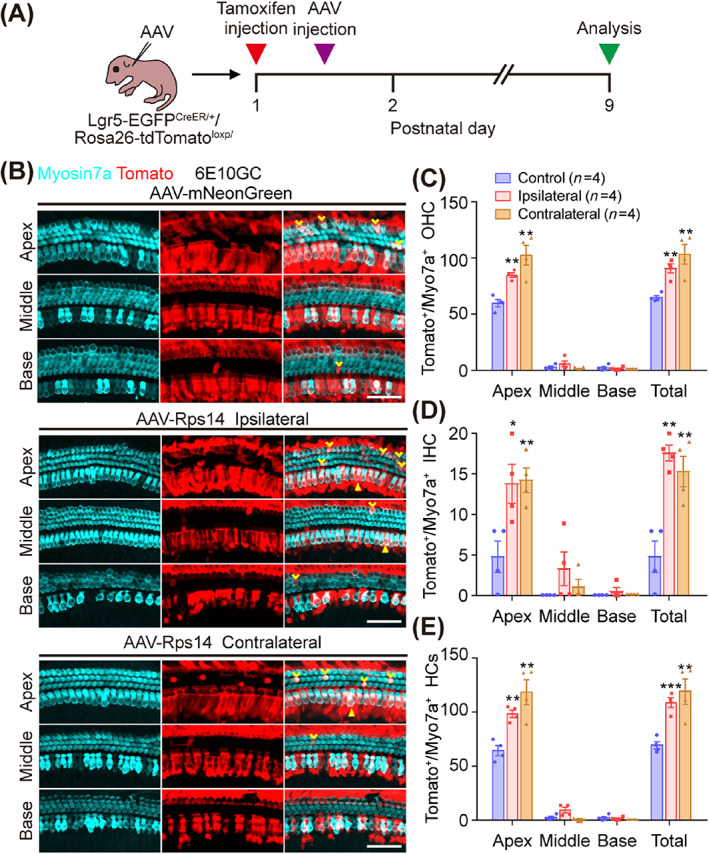
FIGURE 7.

Lineage tracing of Lgr5+ supporting cells. (A) Experimental design of lineage tracing. (B) Lineage tracing images of Lgr5+ supporting cells in AAV‐mNeonGreen, AAV‐Rps14‐ipsilateral, and AAV‐Rps14‐contralateral cochleae. Tamoxifen was injected at P1, and AAV was injected 12 h later. Sox2+ supporting cells were traced by following the expression of tdTomato fluorescent protein (red). Cochlea were injected with AAV‐mNeonGreen and AAV‐Rps14 at the same dose (6 × 10¹⁰ GCs per cochlea) and harvested at P9. Myosin7a (cyan) marks hair cells. Scale bars, 50 μm. (C,E) Quantification of tdTomato+ OHCs (C), IHCs (D) and hair cells (HCs) (E) per cochlea. Yellow arrowheads indicate the OHCs, and the triangles indicate the IHCs. n refers the number of mice, and the results are shown as the mean ± SEM (n = 4). The p‐value was calculated by one‐way ANOVA with Tukey's multiple comparison test. (*p < 0.05, **p < 0.01, ***p < 0.001). IHCs, inner hair cells; OHCs, outer hair cells.
