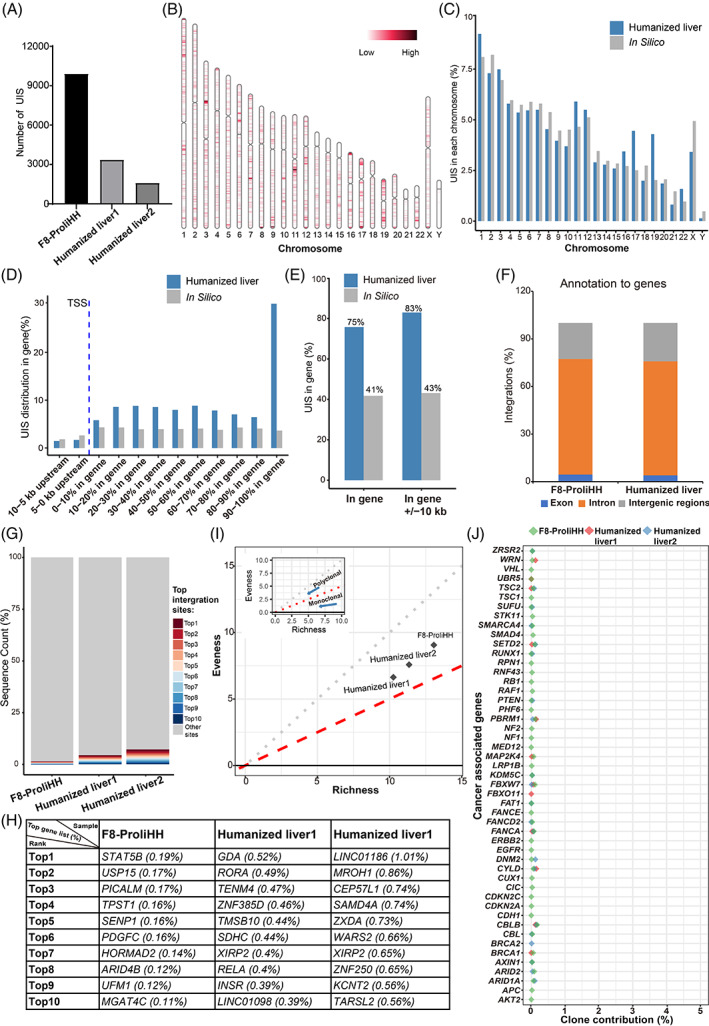
FIGURE 5.

Integration profile of F8‐modified proliferating human hepatocytes (ProliHHs). (A) Integration numbers were identified in libraries obtained from F8‐ProliHHs and F8‐ProliHHs repopulated mice livers (humanized livers) using two long terminal repeat primers. (B) Integrations were mapped to the human genome and distribution of lentivirus integration sites in the human chromosomes. Chr, chromosome. (C) Integration site proportions were counted in each human chromosome. Bars in grey represent percentages corresponding to a random distribution of unique integration sites (UISs) in silico, while blue bars represent actual proportions of UISs determined in the two humanized livers. (D) Distribution of the UISs determined in genes and genes ±10 kb. TSS, transcription start site. (E) 75% UISs were observed in gene regions, while 83% UISs were observed in gene ±10 kb regions. No clustering around TSS regions was observed. Bars in grey represent percentages corresponding to a random distribution of UISs in silico, while blue bars represent actual proportions of UISs determined in the two humanized livers. (F) Percentage of integrations mapped to exons, introns, and intergenic regions. (G) The proportions of the 10 most represented UISs in F8‐ProliHHs and F8‐ProliHHs repopulated mice livers (humanized livers). (H) The gene list and proportions of the top 10 UISs in F8‐ProliHHs and F8‐ProliHHs repopulated mice livers (humanized livers). (I) Polyclonal‐monoclonal distance (PMD) clonal framework. PMD analysis is conducted from two dimensions: evenness and richness for the clonal diversity of samples. (J) Clone proportions of UISs at 100 kb upstream and downstream around TSS regions of Cancer associate gene.
