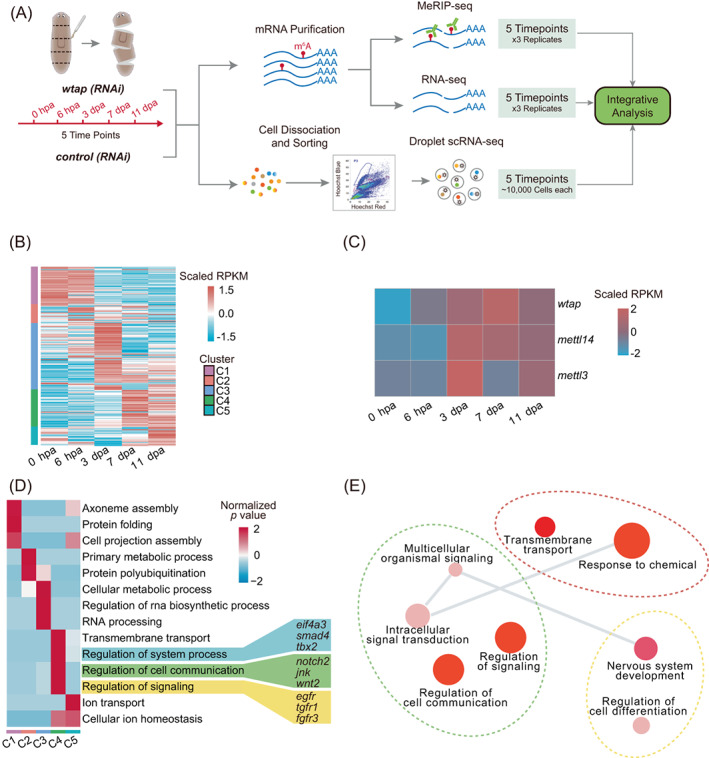
FIGURE 1.

m6A methyltransferase complex upregulated during planarian regeneration. (A) Experimental outline of multi‐omics data including methylated RNA immunoprecipitation sequencing (MeRIP‐seq), bulk RNA‐seq and single‐cell RNA‐seq. (B) Heatmap showing the expression levels of all expressed genes and clustered into five categories based on expression pattern during planarian regeneration (left side of the heatmap). Genes were clustered by MEV with parameter—distance‐metric‐selection = Pearson correlation, number of cluster = 5, maximum iterations = 50 and plot with the parameter ‘pheatmap (matrix, scale =“row”)’ through pheatmap function (R package). (C) Heatmap showing the expression levels of major components of m6A writers during regeneration. (D) Heatmap showing the enriched gene ontology (GO) and important genes of five different categories as shown in (B). The colour bar of heatmap represents z‐score of GO's p‐value. (E) Gene ontology of genes belongs to fourth category (C4) shown in (B). Visualization was performed using Revigo with default parameters (semantic similarity measure = SimRel).
