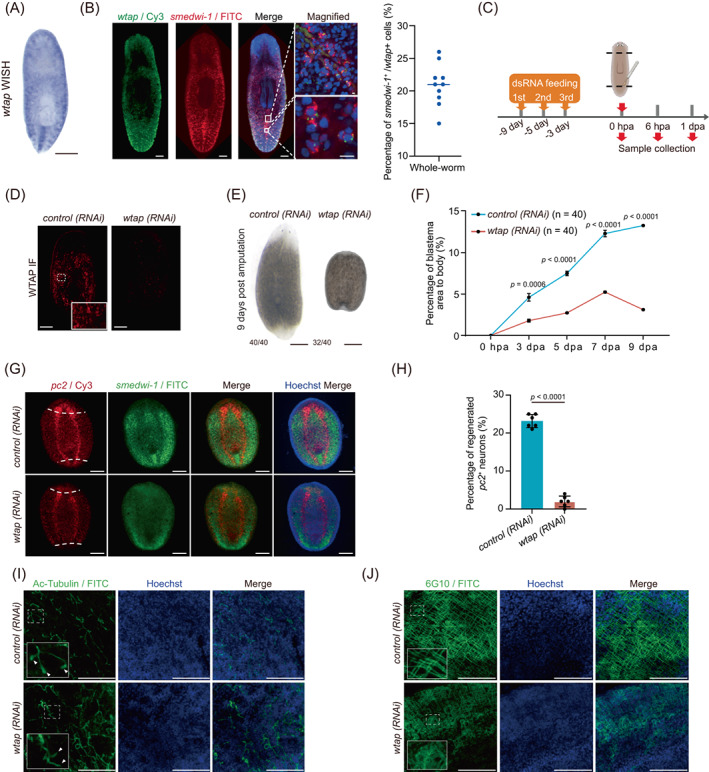
FIGURE 3.

wtap depletion leads to regeneration defects. (A) WISH showing the expression and localization of wtap transcripts in planarians. Scale bar, 300 μm. (B) Whole‐mount fluorescent in situ hybridization showing the expression and localization of wtap and smedwi‐1 transcripts. Scale bar, 100 μm (left panels), 10 μm (right upper row), 10 μm (right lower row). Right panel, scatter plot showing the percentage of smedwi‐1 +/wtap + cells. (C) Schematic diagram showing the knockdown strategy and amputation position. (D) Immunofluorescence showing expression and localization of WTAP protein in control (control) and wtap knockdown (wtap RNA interference [RNAi]) planarians (n ≥ 3). Scale bar, 200 μm. (E) Bright‐field image showing total body sizes for control (control) and wtap knockdown (wtap RNAi) planarians at 9 dpa. Scale bar, 500 μm. Bottom left number, planarians with phenotype of total tested. (F) Percentage of blastema area to total body size in control (control) and wtap knockdown (wtap RNAi) planarians. Error bars represent standard deviation. Data are the mean ± S.D (n ≥ 3 independent experiments). The p values were determined using a two‐sided unpaired Student's t‐test. (G) Whole‐mount fluorescent in situ hybridization showing expressions and localizations of pc2 (red) and smedwi‐1 (green) along whole body of control (control) and wtap knockdown (wtap RNAi) planarians at 7 dpa. Dotted line, amputation plane (n ≥ 3). Scale bar, 200 μm. (H) Quantification analysis of the percentage of regenerated pc2 positive neuron in control (control) and wtap knockdown (wtap RNAi) planarians at 7 dpa. Error bars represent standard deviation. Data are the mean ± S.D. (n ≥ 3 independent experiments). The p values were determined using a two‐sided unpaired Student's t‐test. (I) Immunofluorescence showing the distribution of Ac‐Tubulin protein in control (control) and wtap knockdown (wtap RNAi) planarians at 7 dpa. Arrow indicates the presence of flame cell in the protonephridia of control (control) planarians, and missing in the wtap knockdown (wtap RNAi) planarians (n ≥ 3). Scale bar, 75 μm. (J) Immunofluorescence shows the distribution of 6G10 protein distribution in control (control) and wtap knockdown (wtap RNAi) planarians at 7 dpa. (n ≥ 3) Scale bar, 75 μm. See also Figure S2.
