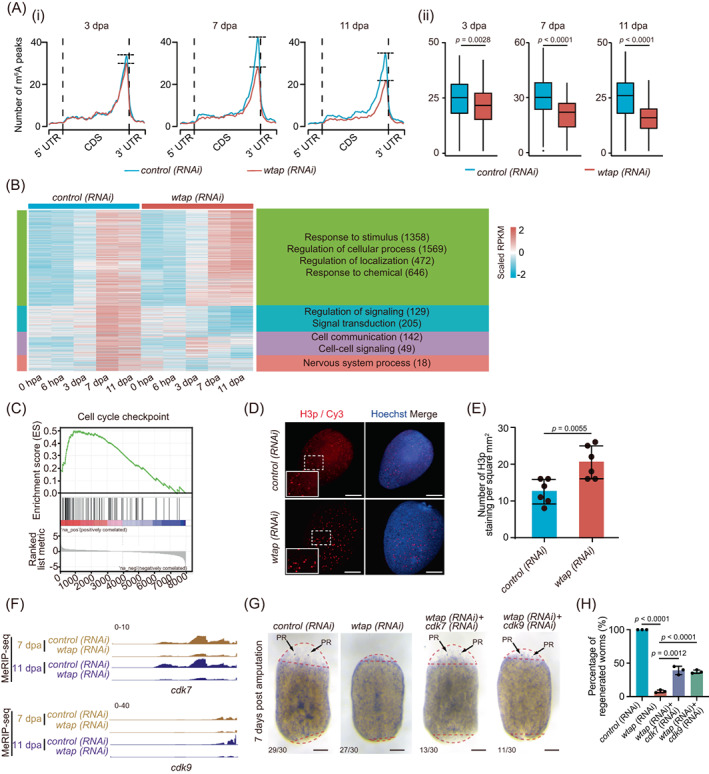
FIGURE 4.

WTAP‐mediated m6A controls cell cycle‐ and cell–cell communication‐related factors. (A) (i) Metagene profiles of m6A peaks along transcripts with three non‐overlapping segments (5′‐UTR, CDS and 3′‐UTR) for control (blue) and wtap knockdown (red) planarians of different regeneration timepoints (3, 7, and 11 dpa). (ii) Boxplot showing the difference in the number of m6A peaks that located near stop codon of transcripts of control (blue) and wtap knockdown (red) planarians at 3, 7 and 11 dpa. The p values were determined using Wilcoxon‐test. (B) For genes from cluster 4 (C4) in Figure 1B, the expression level during regeneration were displayed for both control and wtap knockdown planarians of five timepoints. Then those genes were separated into four new sub‐groups based on expression features and the enriched GO terms were shown for each sub‐group. Genes with different expression pattern were defined by MEV with parameter–distance‐metric‐selection = Pearson‐correlation–number‐of‐cluster = 4–maximum‐iterations = 50. (C) GSEA plots evaluating the changes in cell cycle checkpoint pathway upon wtap depletion. Normalized p value <0.01. (D) Immunofluorescence showing the distribution of H3P protein in control (control) and wtap knockdown (wtap RNA interference [RNAi]) planarians at 5 dpa. Scale bar, 200 μm. Enlarged field was selected to best represent the statistical mean of staining signals. (E) Statistical analysis for H3p immunostaining. Error bars represent standard deviation. Data are the mean ± S.D. (n ≥ 3 independent experiments). The p values were determined using a two‐sided unpaired Student's t‐test. (F) Integrative genomics viewer tracks displaying the distributions of MeRIP‐seq data that normalized by RNA‐seq data along cdk7 and cdk9 in both control (top) and wtap knockdown (bottom) planarians at 7 dpa and 11 dpa. (G) Bright‐field images showing the phenotypes of control, wtap, cdk7 + wtap and cdk9 + wtap knockdown planarians at 7 dpa. Scale bar, 200 μm. Bottom left number, number of planarians with phenotype versus total number tested. (H) Barplot showing percentage of regenerated worms to total sample size in control, wtap, cdk7 + wtap and cdk9 + wtap knockdown planarians at 7 dpa. Error bars represent standard deviation. Data are the mean ± S.D. (n ≥ 3 independent experiments). The p values were determined using a two‐sided unpaired Student's t‐test. See also Figure S3.
