FIGURE 5.

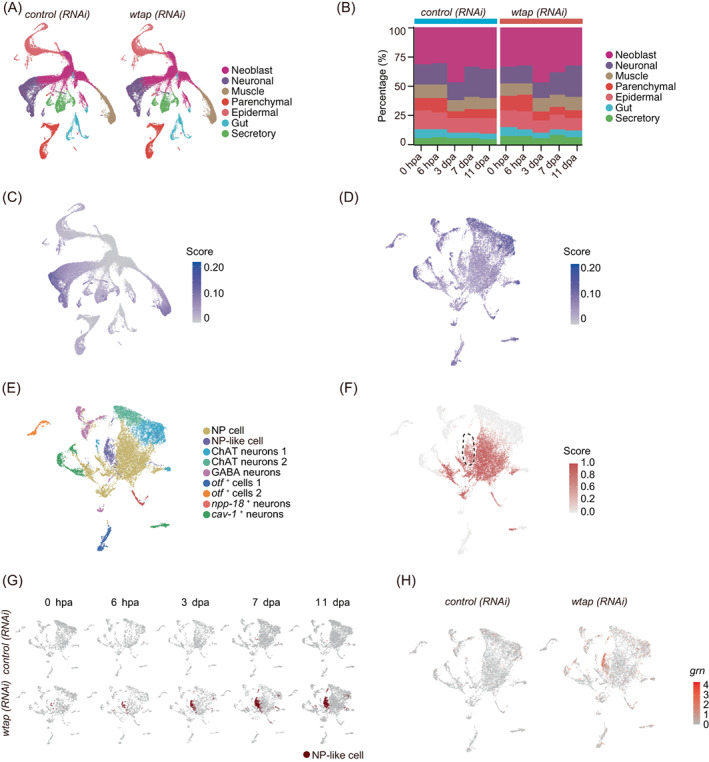
Single‐cell atlas unveils cell‐type specific regulation of WTAP essential for regeneration. (A) Based on single‐cell RNA‐seq data, Uniform Manifold Approximation and Projection (UMAP) detect major cell types in both control (left) and wtap knockdown (right) planarians of 5 timepoints during regeneration (0 hpa, 6 hpa, 3 dpa, 7 dpa and 11 dpa). Each point depicts a single cell, coloured according to cell types. (B) The percentage of each cell type in control (left) and wtap knockdown (right) planarians during regeneration. (C) Expression score of transcripts with m6A modifications are plotted onto the UMAP map. Expression score is calculated by using the AddModuleScore function from Seurat, and the transcripts used to score cells are from cluster 4 (C4) of Figure 1B and required with m6A modification. (D) Expression score of transcripts with m6A modifications are plotted onto the UMAP map in neuronal cells. Expression score is calculated by using the AddModuleScore function from Seurat, and the transcripts used to score cells are from cluster 4 (C4) of Figure 1B and required with m6A modification. (E) UMAP plot demonstrates nine sub‐clusters of neuronal cells in control and wtap knockdown planarians. Each point depicts a single cell, coloured according to cell types. (F) The NP cell prediction score of neuronal cells. The score is calculated by using the TransferData function from Seurat and the score represents the degree of similarity to neuronal progenitor cells. (G) UMAP plot showing a novel cell type, NP‐like cells, mainly occur in wtap knockdown planarians but rarely in controls. Each point depicts a single cell. (H) Expression level of grn in neuronal cells. Control samples on the left, wtap knockdown samples on the right. See also Figure S4.
